# A tibble: 3 × 2
  threshold_hours coverage
            <dbl>    <dbl>
1              24    0.908
2              48    0.973
3 72 0.98229 SLA Coverage
29.1 Why this matters
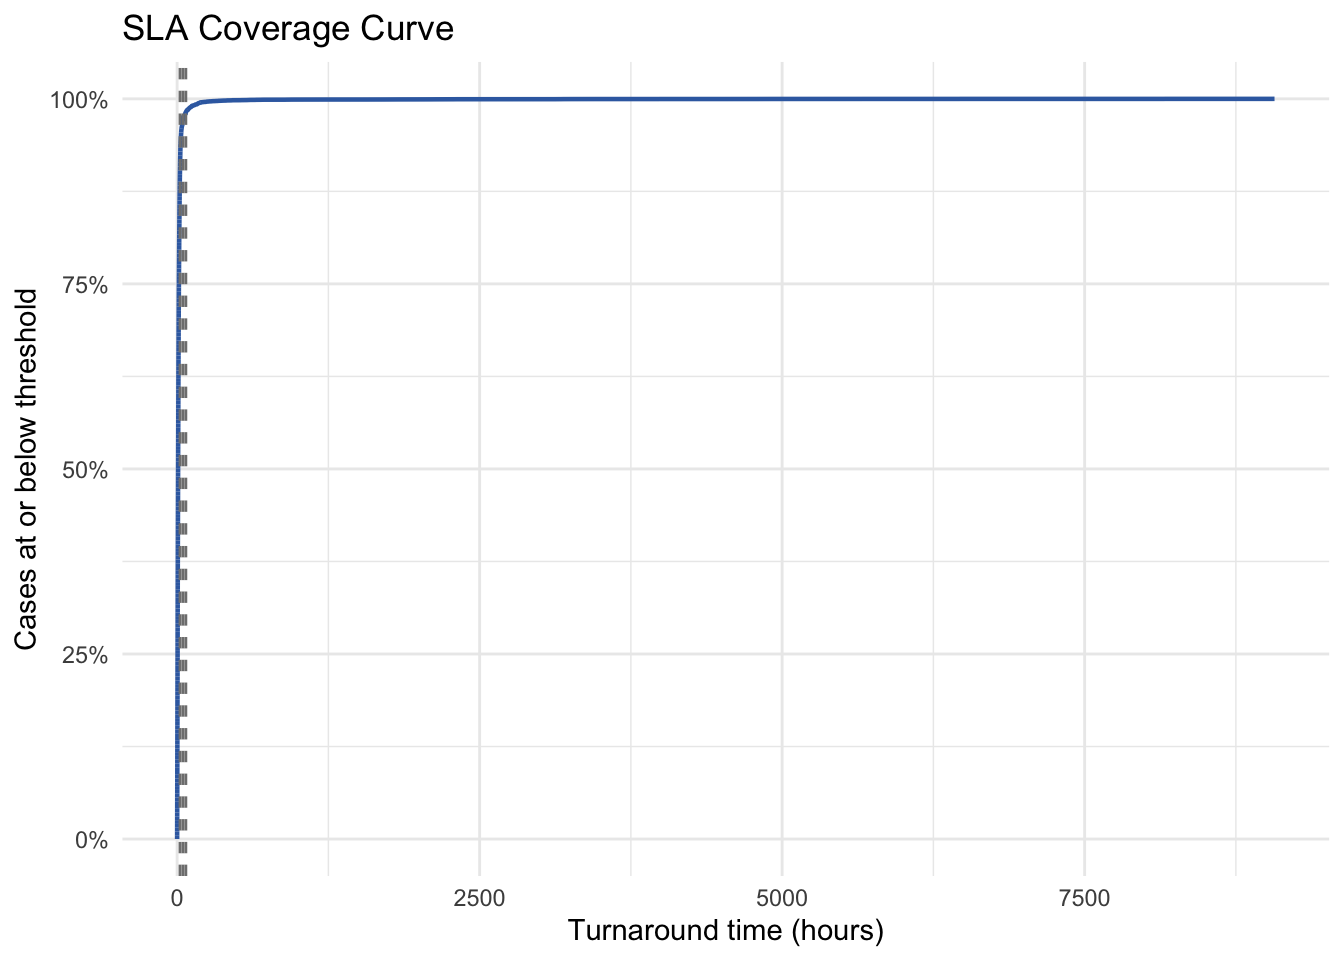
SLA coverage shows how many cases meet the expected turnaround windows (24/48/72 hours). It frames performance in a way clinicians and leadership recognize.
29.2 Coverage Table
29.3 Coverage Curve
29.4 Interpretation Guide
- Coverage at 24/48/72 hours is the headline metric; track it weekly.
- The slope of the coverage curve shows how quickly cases complete; a long flat tail indicates persistent outliers.
- If coverage dips after process changes, inspect which leg (Lab→Scan, Scan→PACS) dominates those late cases and address that stage first.