Based on the **90th percentile of proven throughput** in your lab:

- **One GT450** can sustainably process **1e+05** slides/year.
- **Forecasted Peak Volume** requires **1** high-throughput scanners.30 Demand Forecasting & Capacity Planning
30.1 Executive Summary: Scanner Requirements
30.2 1. Demand Forecast (Next 12 Months)
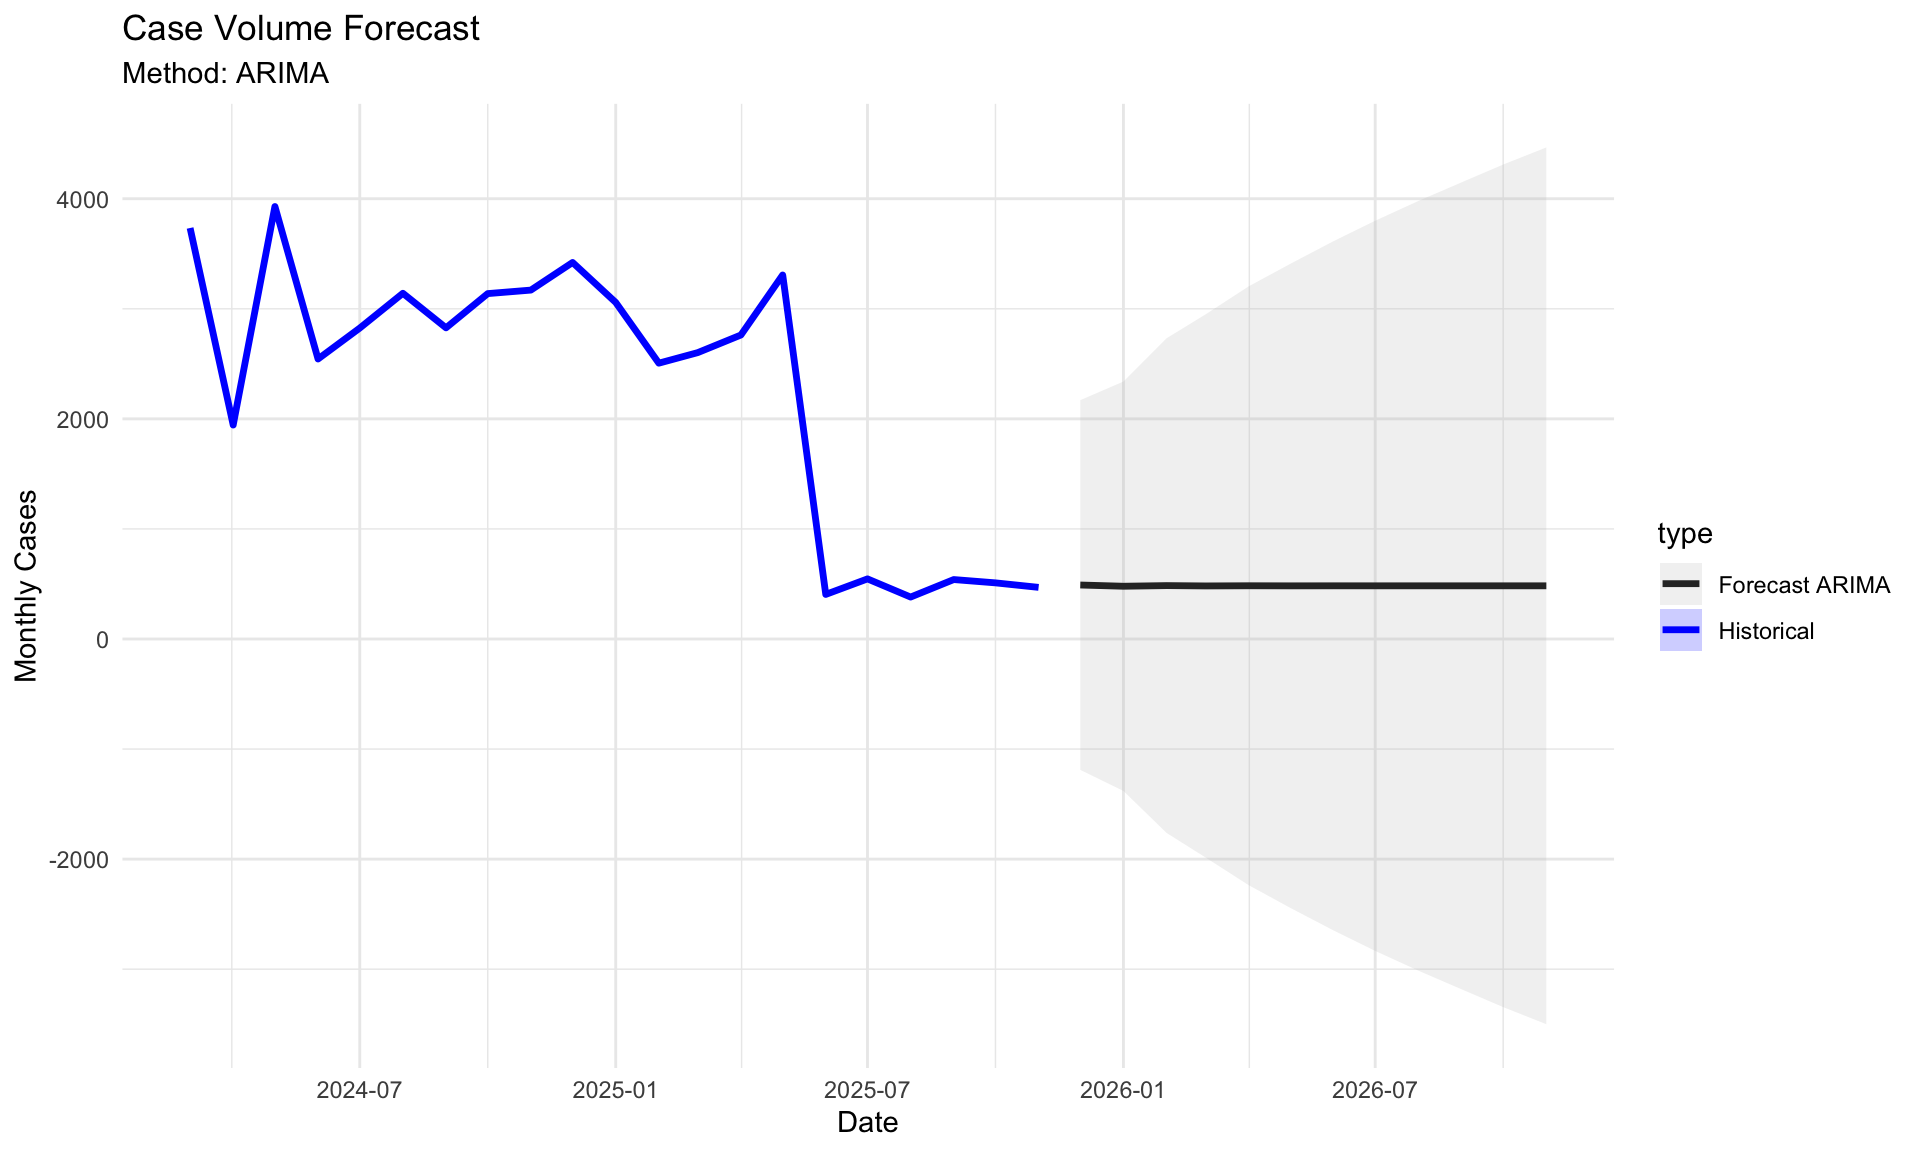
We project slide volume using historical trends and seasonality.
30.3 2. Effective Scanner Capacity
Instead of theoretical manufacturer specs, we use your actual data to determine capacity. We define “Sustainable Capacity” as the 90th percentile of daily throughput achieved by each model type.
| Scanner Model | Max Sustainable Daily Slides | Annual Capacity (Slides/Yr) |
|---|---|---|
| GT450 | 30 | 7800 |
Note: Annual capacity assumes 260 operational days per year (5 days/week).
30.4 3. Gap Analysis: Required Fleet Size
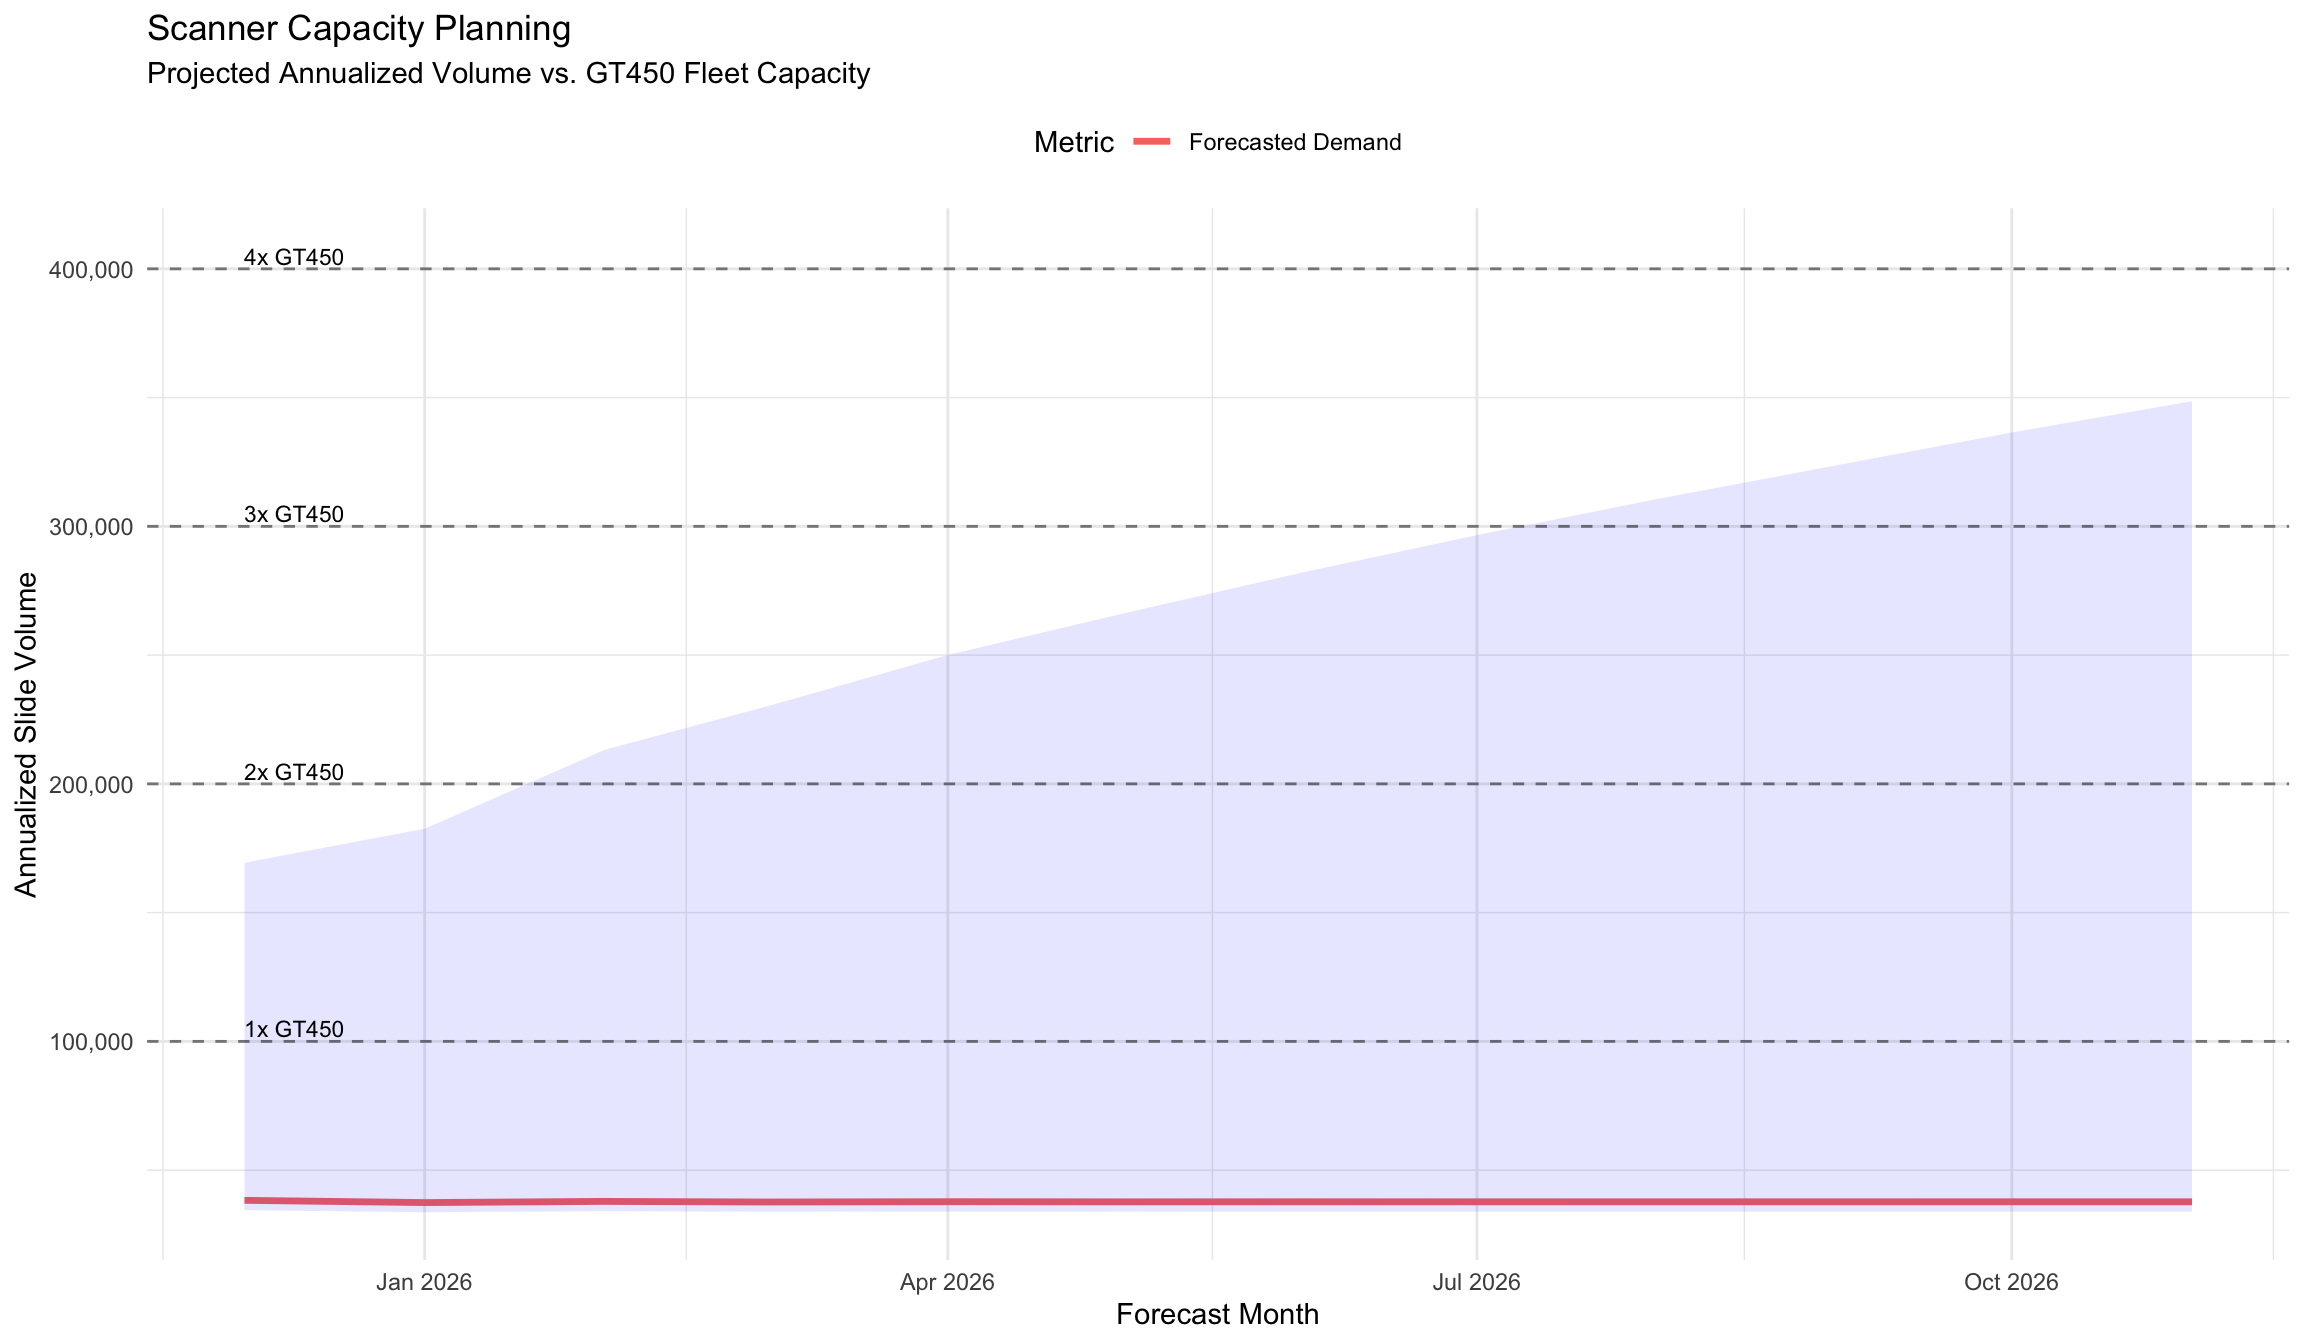
This chart shows the forecasted annualized volume against the capacity of 1, 2, 3, and 4 scanners.
30.4.1 Monthly Requirement Forecast
The table below details how many GT450-class scanners are needed to meet demand for each upcoming month.
| Month | Monthly Slides | Annualized Rate | Required GT450s |
|---|---|---|---|
| 2025-12-01 | 3190 | 38285 | 1 |
| 2026-01-01 | 3117 | 37405 | 1 |
| 2026-02-01 | 3156 | 37867 | 1 |
| 2026-03-01 | 3135 | 37625 | 1 |
| 2026-04-01 | 3146 | 37752 | 1 |
| 2026-05-01 | 3140 | 37685 | 1 |
| 2026-06-01 | 3143 | 37720 | 1 |
| 2026-07-01 | 3142 | 37702 | 1 |
| 2026-08-01 | 3143 | 37711 | 1 |
| 2026-09-01 | 3142 | 37706 | 1 |
| 2026-10-01 | 3142 | 37709 | 1 |
| 2026-11-01 | 3142 | 37708 | 1 |
30.5 4. Recommendation
- If “Required GT450s” > Current Fleet: Plan procurement 3 months in advance.
- Safety Margin: The analysis assumes a linear 5-day week. If you rely on weekend catching-up, your true capacity is effectively higher, but this risks burnout.
- Efficiency First: Before buying, maximize
analysis/scanner_performance_deepdive.qmdmetrics (reliability & utilization). Improving utilization from 70% to 90% is cheaper than a new scanner.