| Parameter | Value |
|---|---|
| Scanner Investment | $250,000 |
| Lifespan | 10 years |
| Annual Maintenance | $25,000 |
| Labor Cost/Hour | $50 |
| Pathologist Cost/Hour | $150 |
| Delay Cost/Hour | $75 |
28 Enhanced Cost-Benefit Analysis
28.1 Introduction
Comprehensive financial analysis quantifies the true cost of digital pathology operations and identifies high-ROI improvement opportunities.
28.2 Cost Parameters
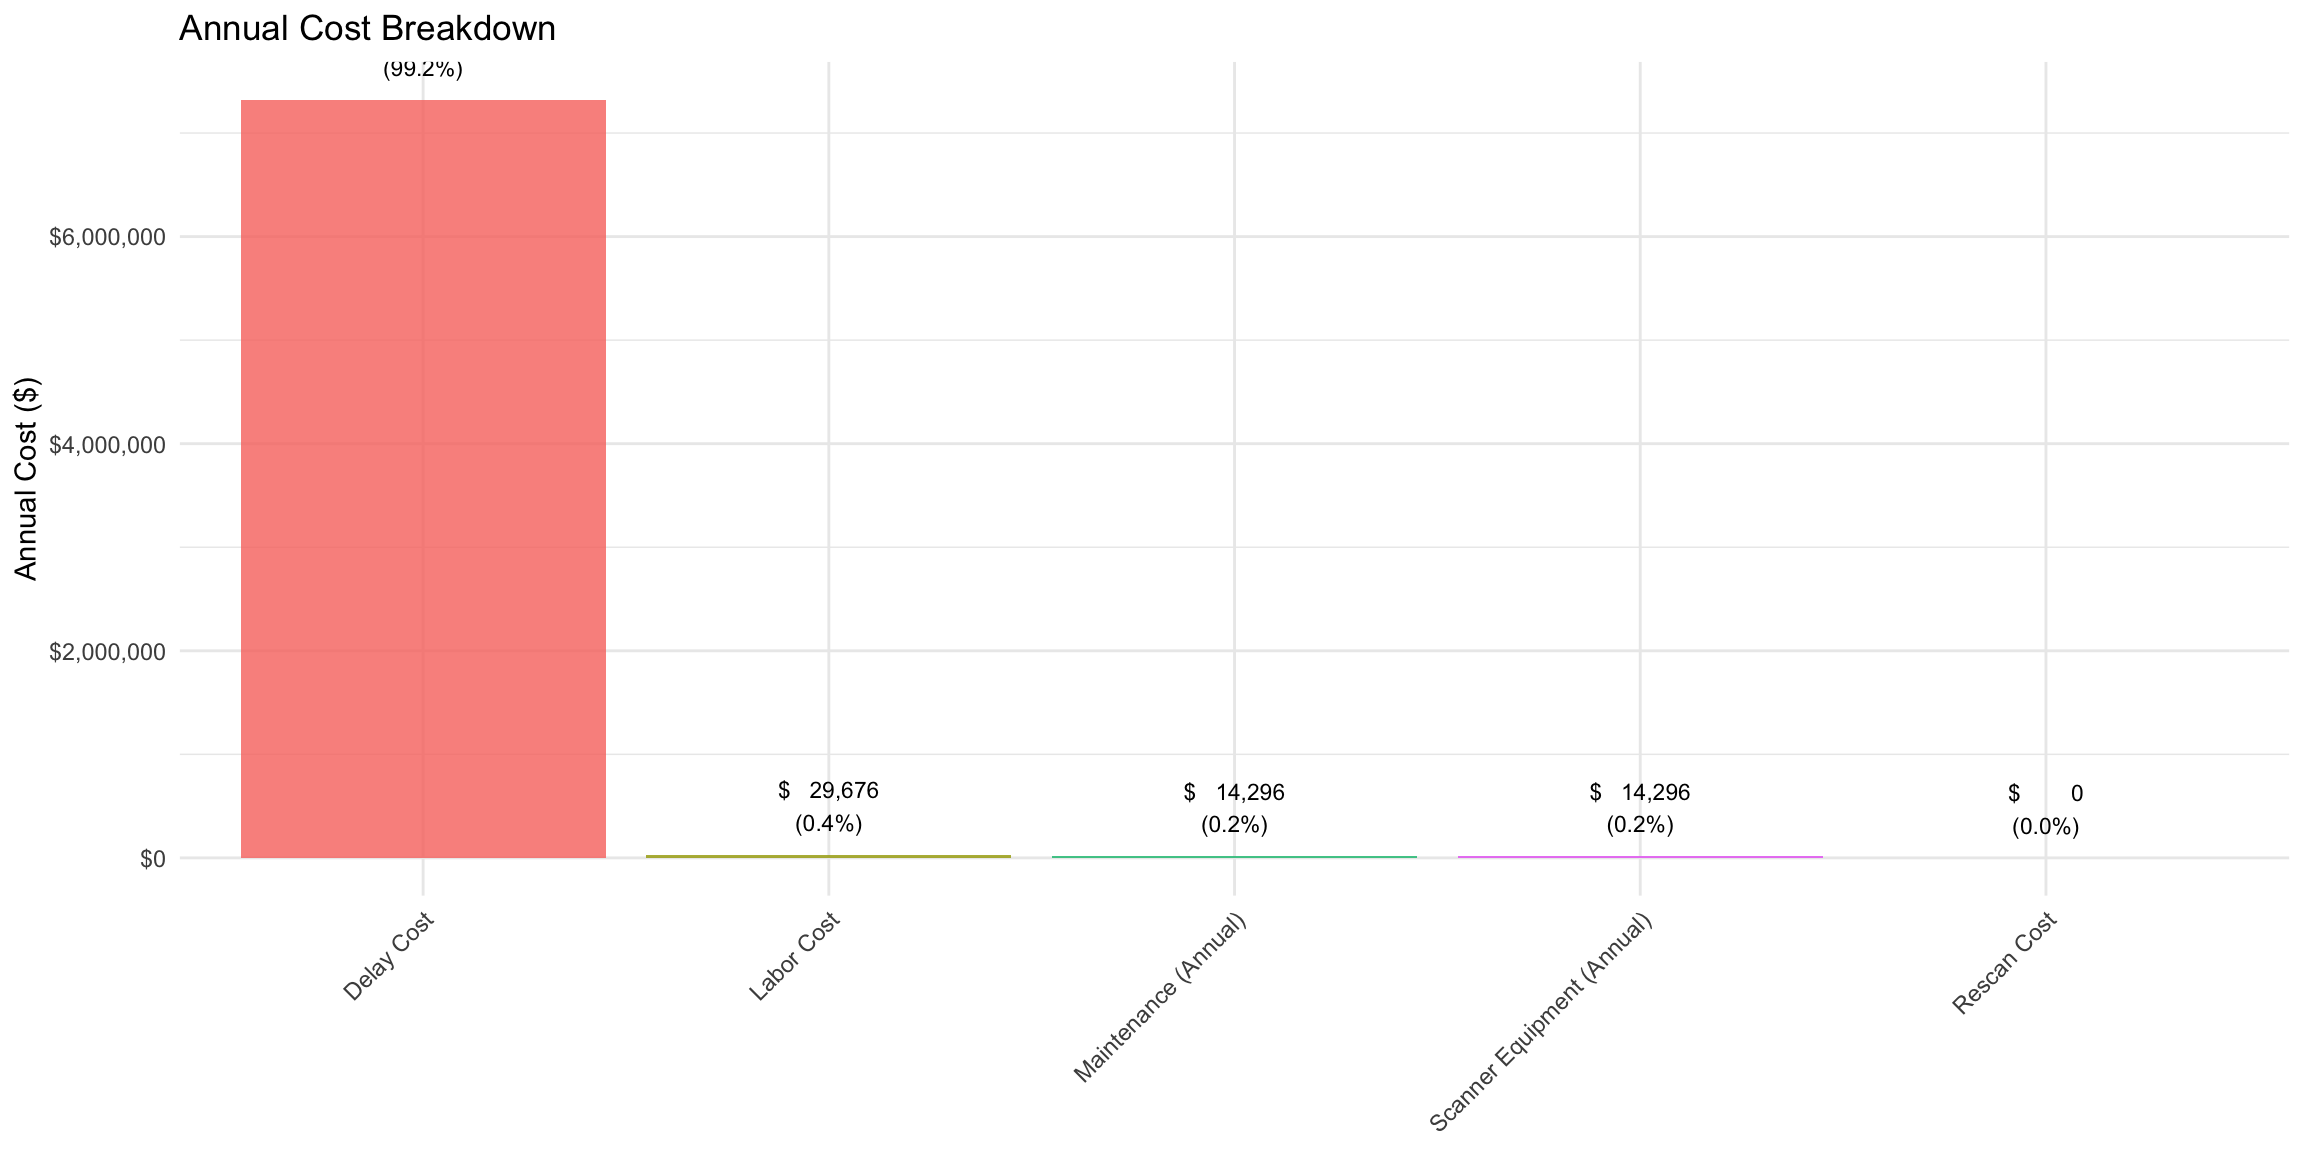
28.3 Annual Cost Breakdown
| Category | Annual Cost | % of Total |
|---|---|---|
| Scanner Equipment (Annual) | $ 14,296 | 0.2 |
| Maintenance (Annual) | $ 14,296 | 0.2 |
| Labor Cost | $ 29,676 | 0.4 |
| Delay Cost | $7,321,657 | 99.2 |
| Rescan Cost | $ 0 | 0.0 |
28.4 Cost Metrics
| Metric | Value |
|---|---|
| Cost per Slide | $0.57 |
| Cost per Case | $154.52 |
| Cost per Case (On-Time) | $2.58 |
| Cost per Case (Delayed) | $3233.97 |
Scanner cost per slide: $0.57
28.5 Delay Cost Impact
| Metric | Value |
|---|---|
| Cases Delayed (>24h) | 2,282 |
| Total Delay Hours | 170721 hrs |
| Total Delay Cost | $12,804,056 |
| Avg Cost per Delayed Case | $5610.89 |
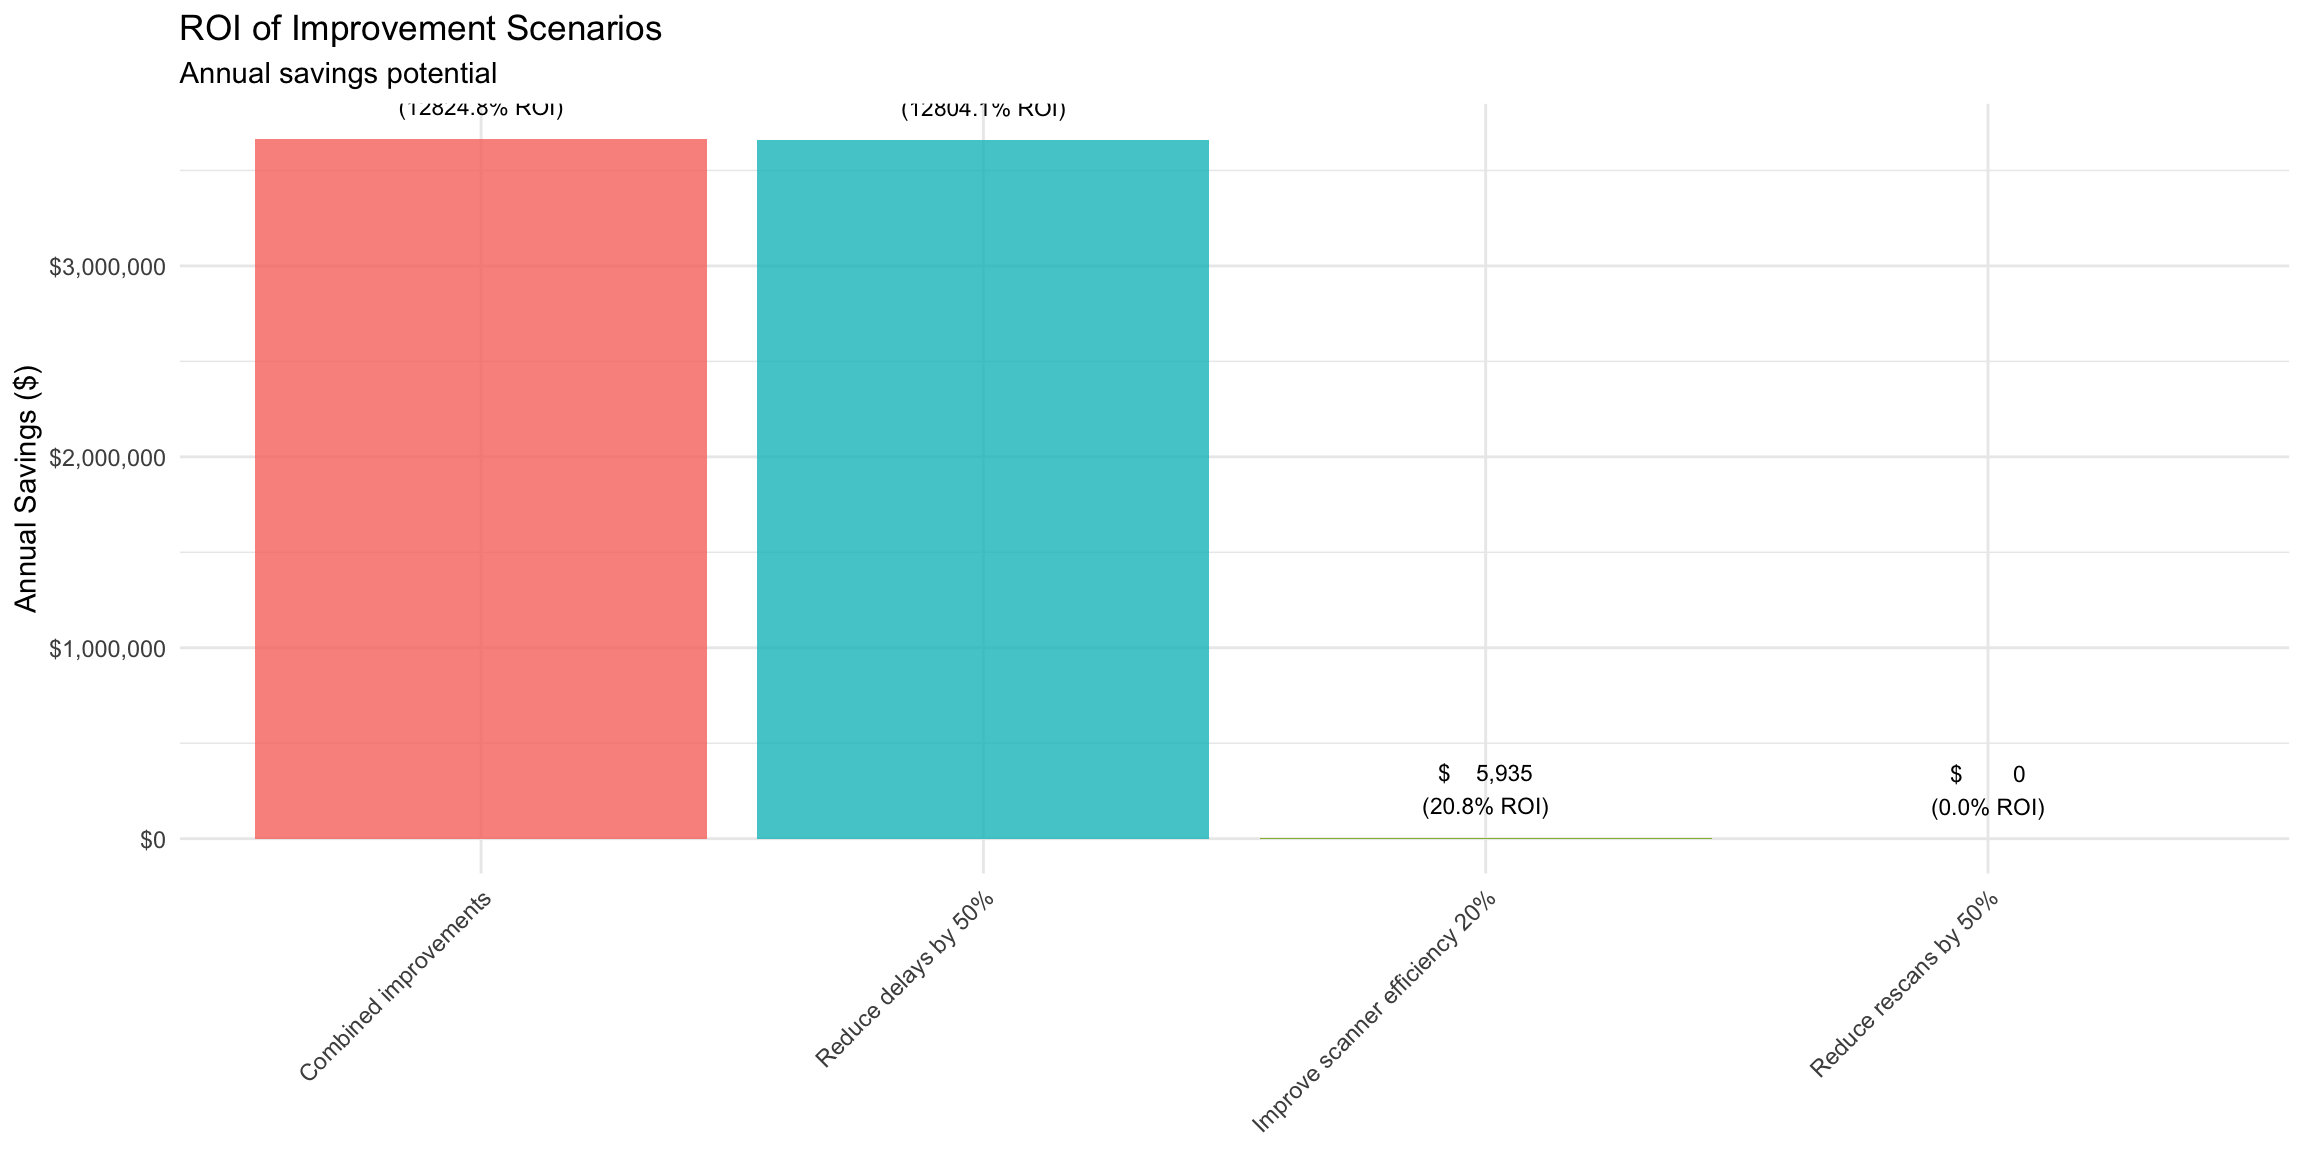
28.6 ROI of Improvement Scenarios
| Scenario | Annual Savings | ROI |
|---|---|---|
| Reduce delays by 50% | $3,660,828 | 12804.1% |
| Reduce rescans by 50% | $ 0 | 0.0% |
| Improve scanner efficiency 20% | $ 5,935 | 20.8% |
| Combined improvements | $3,666,764 | 12824.8% |
28.7 Conclusion
Key Findings: 1. Delays represent 99.2% of total cost 2. Highest ROI: Focus on reducing extreme delays 3. Combined improvements could save $3,666,764 annually