14 Queue and Capacity Analysis
14.1 Why this matters
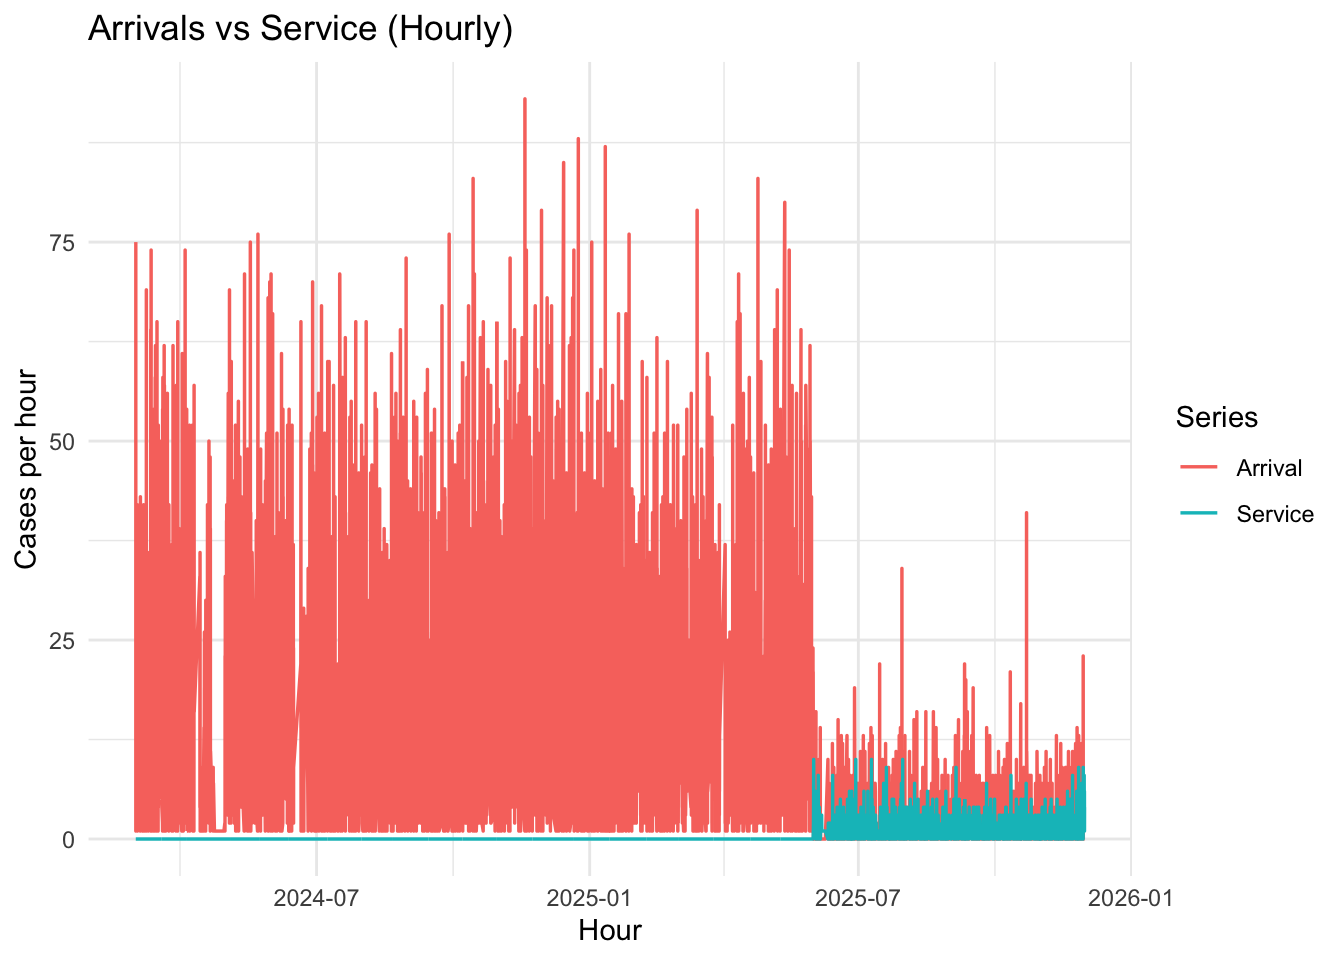
This section compares the arrival rate of cases leaving the lab with the service rate of scanners to estimate backlog (queue) growth. It helps answer “when are we falling behind?” and “what capacity shift would prevent queues?”
14.2 Arrival vs Service Rates (Hourly)
14.3 Estimated Queue Length Over Time
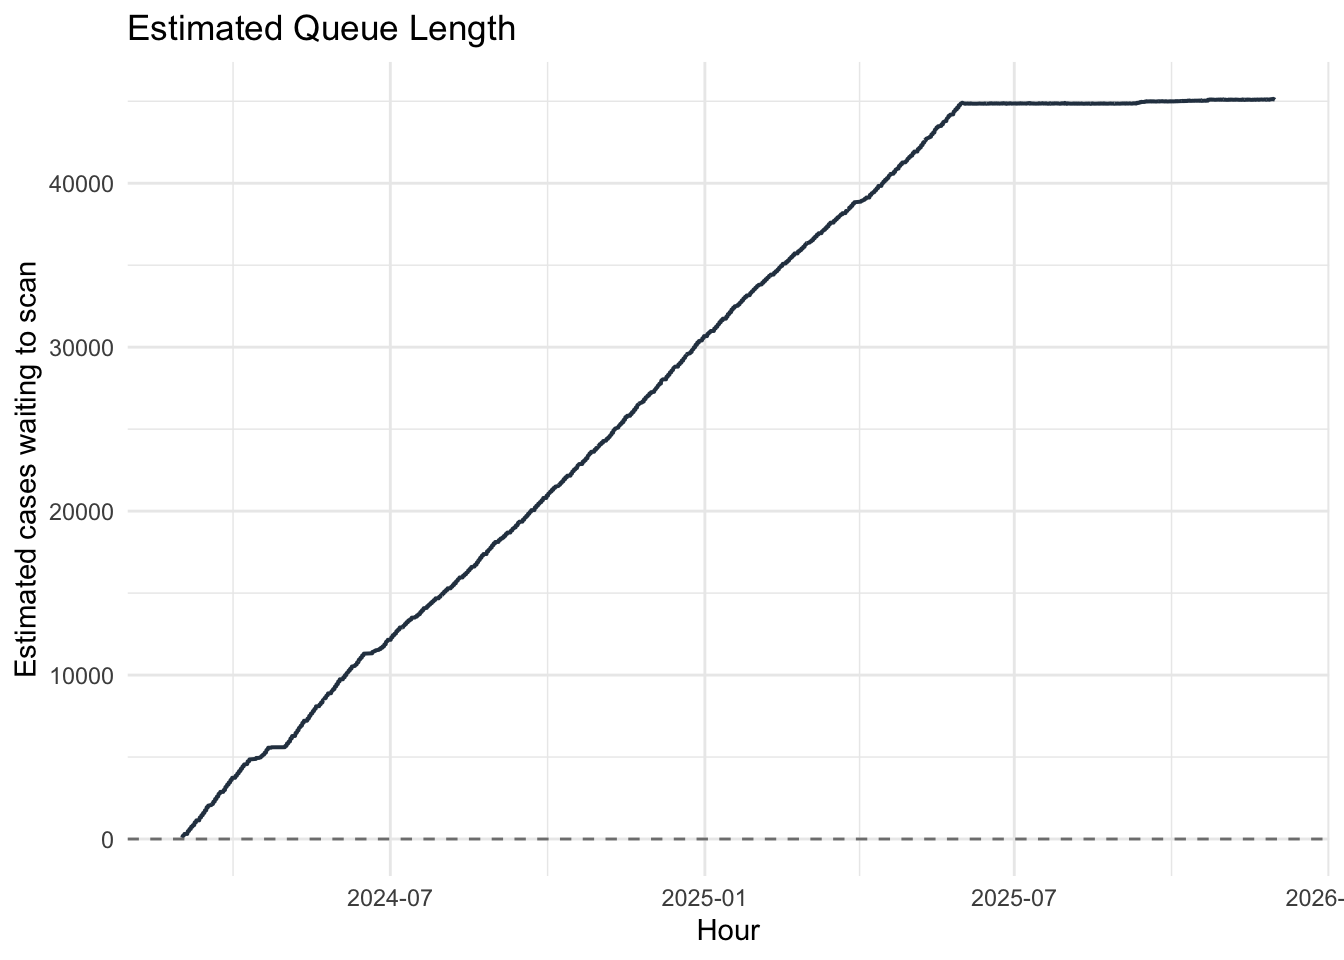
Queue length is approximated as the cumulative difference between arrivals and completions.
14.4 Interpretation Guide
- Peaks in
Arrivalsthat exceedServicesignal times when backlog grows; repeated peaks suggest structural understaffing. - A rising
queue_sizecurve shows accumulating work-in-progress; flattening/declining curves indicate recovery periods. - Check whether weekend/shift patterns align with queue spikes; adjust loading or staffing during those windows.
- If queue routinely exceeds a known buffer (e.g., rack capacity), consider smoothing arrivals (staggered loading) or boosting service (extra scanner hours) during those peaks.