| Slide Count | Cases | Median Scan Duration (hrs) | Time per Slide (hrs) | Overhead (%) |
|---|---|---|---|---|
| 2-5 slides | 6 | 0.01 | 0.00 | NA |
| 6-10 slides | 2 | 0.52 | 0.05 | NA |
| 11-20 slides | 1 | 0.13 | 0.01 | NA |
11 Case Complexity Analysis
11.0.1 File Size Benchmarks (Leica GT450)
- Small Biopsies: 0.4 - 0.9 GB
- Resections: 1.7 - 2.4 GB
- Z-stacks (Cytology): 2.0+ GB
Understanding these distributions helps predict storage needs and network load.
11.0.2 Temporal Penalties for Complex Cases
[!NOTE] Hypothetical Estimates - Require Validation
The following time penalties are theoretical estimates based on general digital pathology knowledge. These have NOT been validated against the actual data in this project and should be treated as hypothetical until confirmed by analysis.
Potential factors affecting scan time: - Fatty tissue: May cause tissue detection issues due to low contrast - Thick sections: Can require multiple focus adjustments - Cytology (Z-stack): Requires multi-plane scanning - Bone marrow: May require oil immersion at high magnification
To validate these effects in your data, analyze scan duration by tissue type or staining method if this information is available in your dataset.
Pathologist Note: If you notice sudden backups in the scanner queue, consider whether “difficult” cases (complex tissue types) might be the cause rather than hardware failure.
11.1 Introduction
Case complexity (tissue size, type) directly affects scan duration and file size. Case complexity, primarily driven by the number of slides per case, significantly impacts scanning workflow efficiency. This analysis investigates how slide count affects scan duration, identifies optimal batch sizes, and quantifies overhead costs.
11.2 Load Data and Run Analysis
11.3 Summary Statistics by Slide Count
The table below shows how scan duration varies with case complexity:
11.4 Scan Duration by Staining Type
We analyze if staining type (H&E vs IHC) impacts scan duration.
[1] "Staining data not available."11.5 Scan Duration by Complexity
This plot shows the distribution of scan durations for different case complexities:
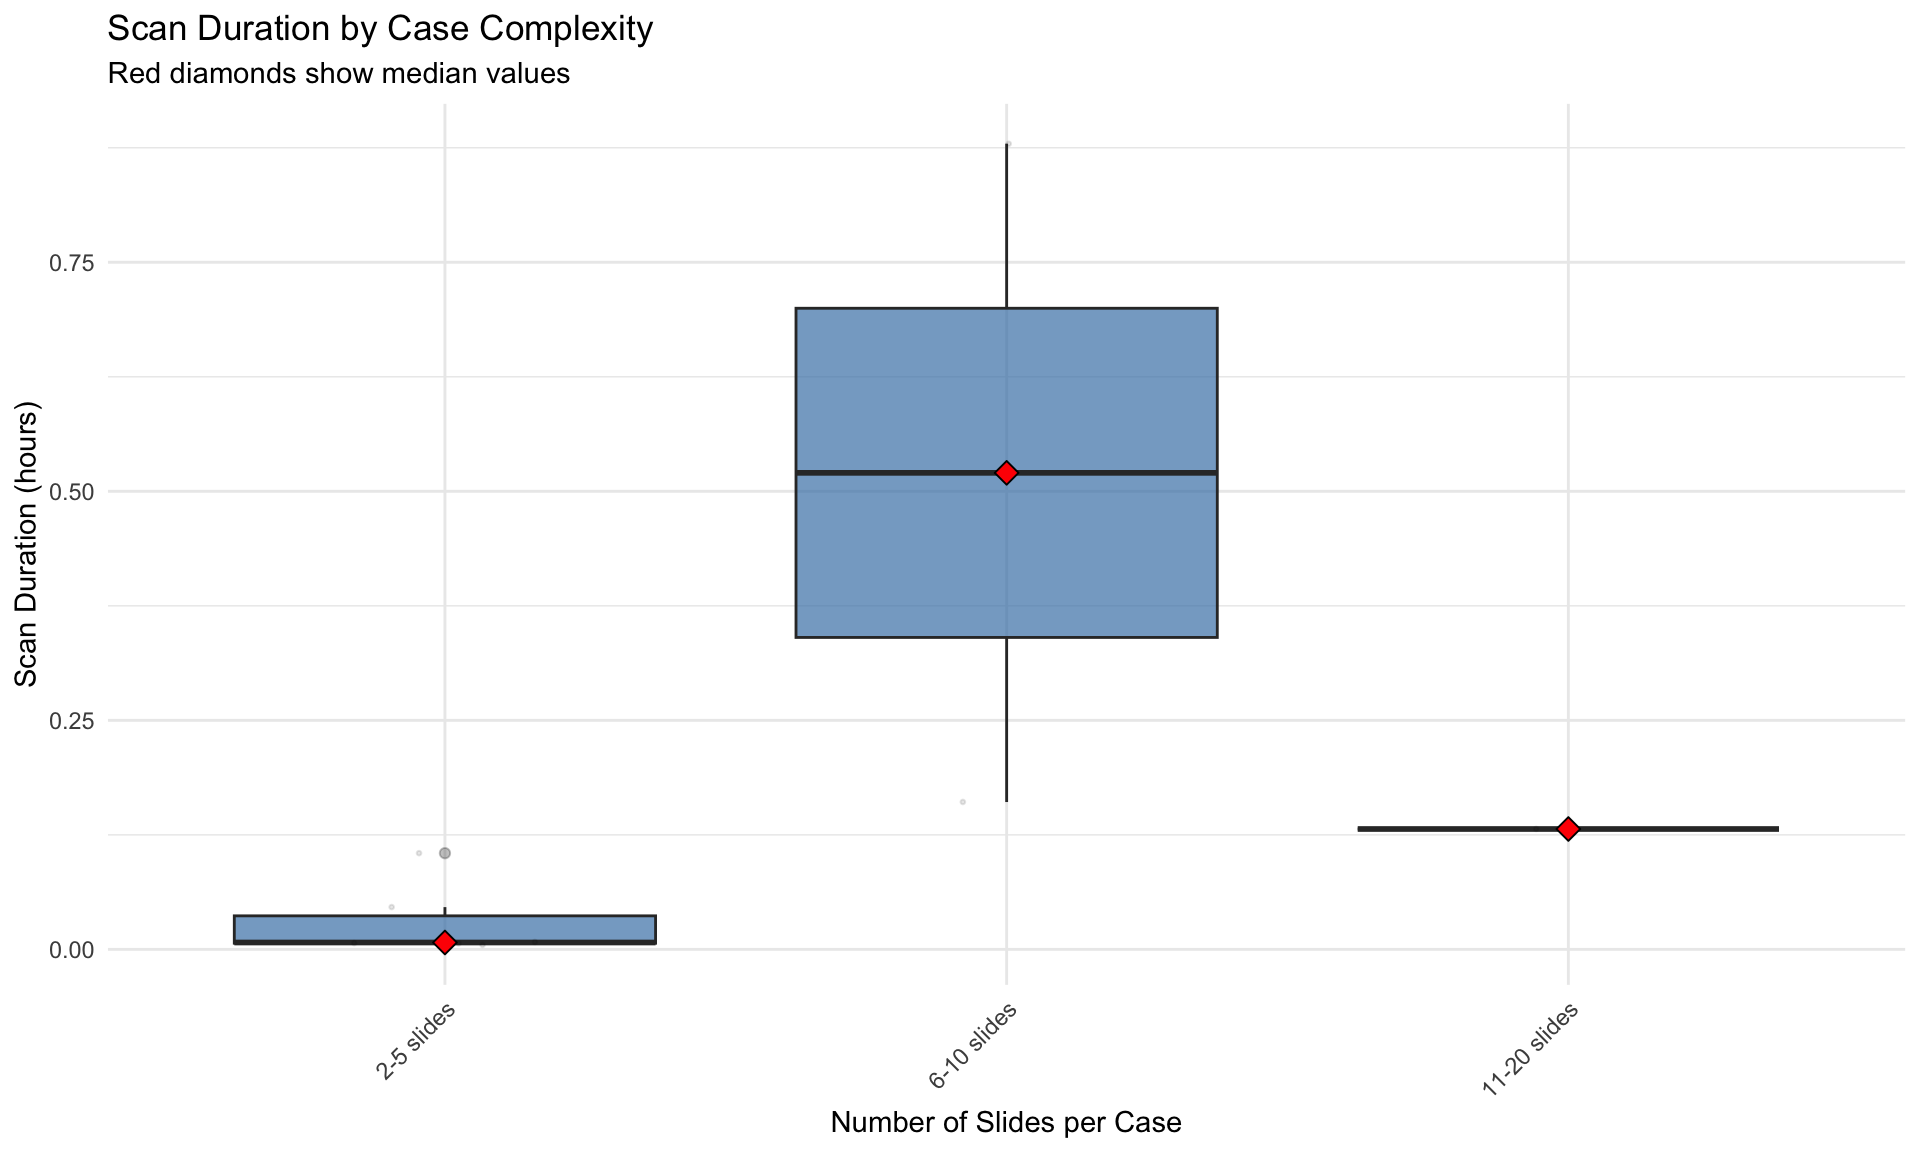
Key Findings: - Single-slide cases have the most predictable scan times - Multi-slide cases show higher variability - Median scan time increases with slide count
11.6 Scanning Efficiency: Time per Slide
Analyzing time per slide reveals batch loading efficiency:
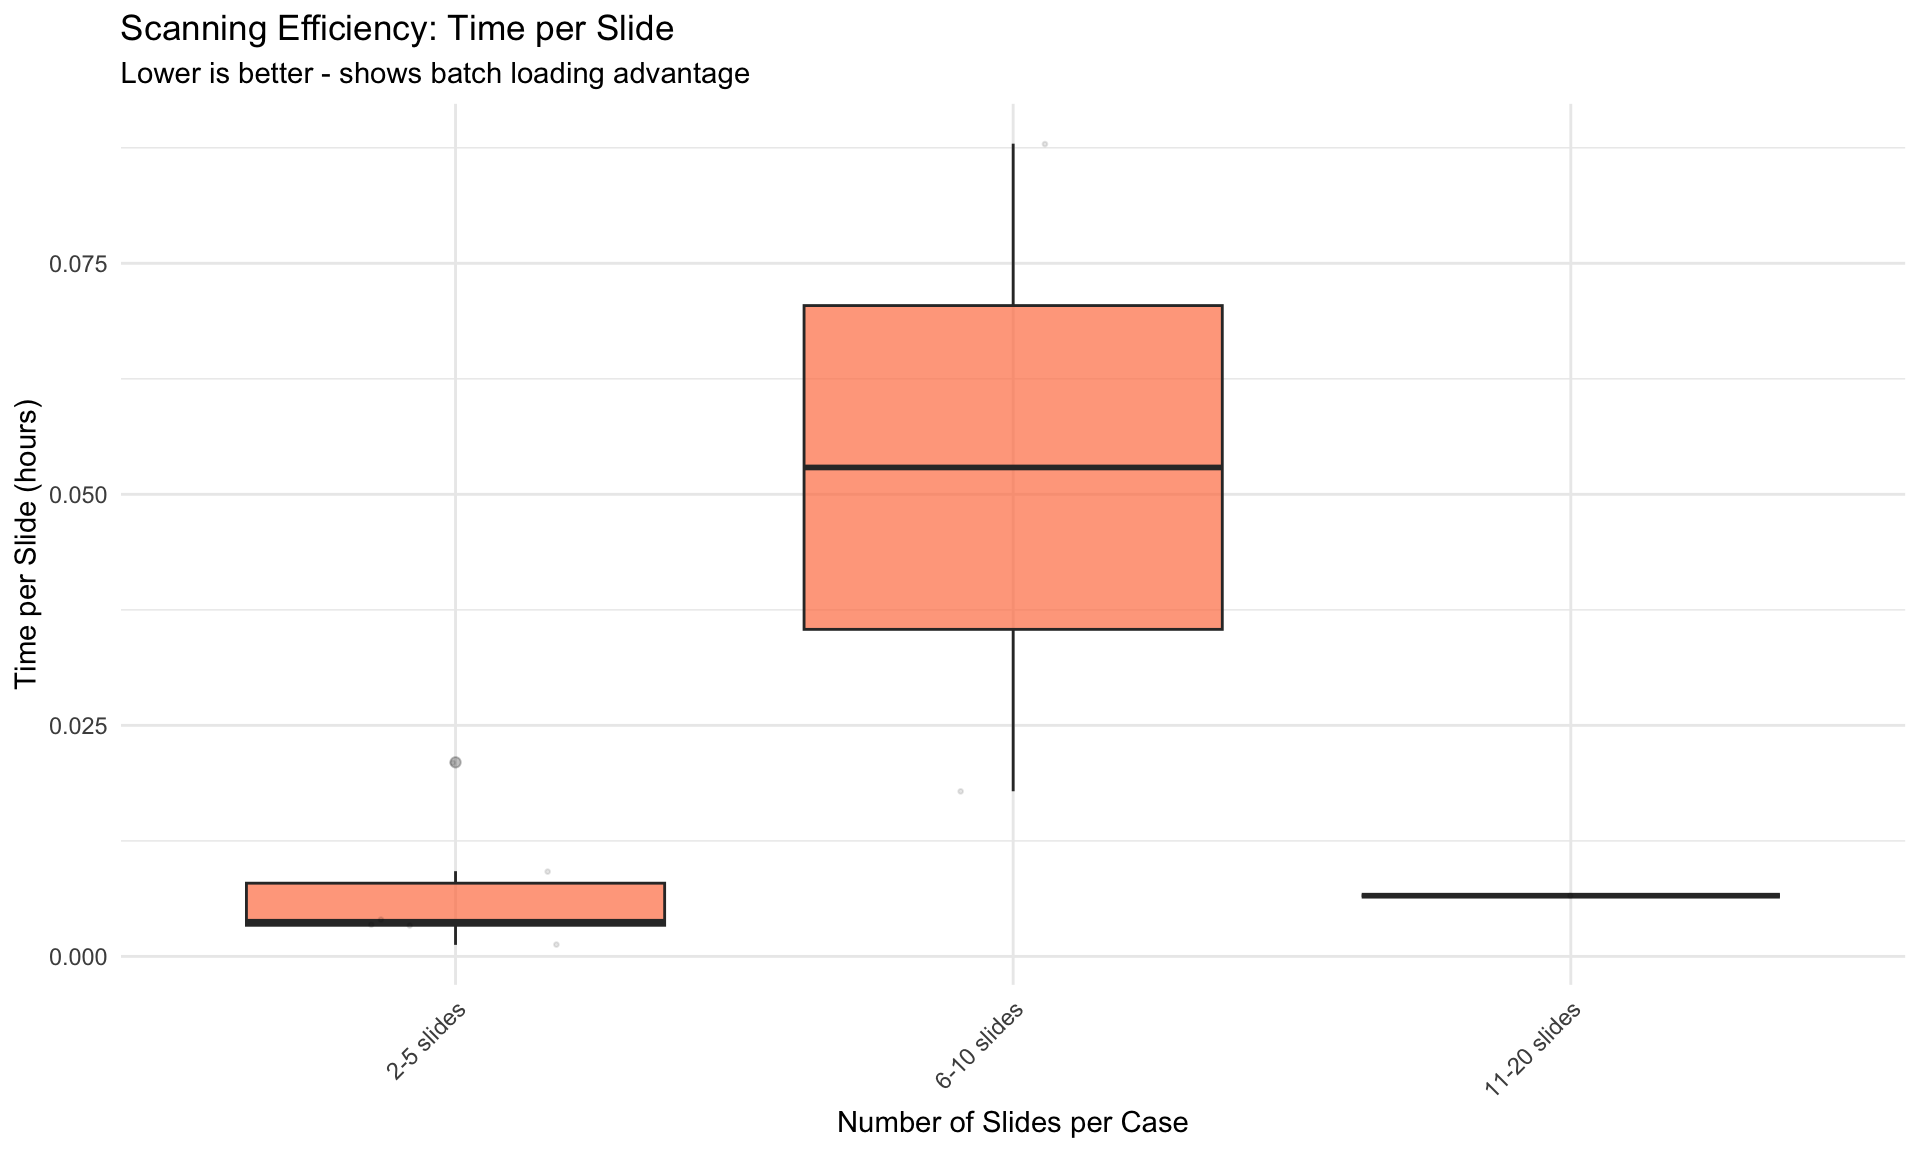
Interpretation: - Lower time per slide indicates better batch efficiency - Multi-slide cases benefit from reduced per-slide overhead - Optimal batch size can be identified from this metric
11.7 Batch Loading Overhead
This chart quantifies the additional time required beyond simple linear scaling:
Notes: - Overhead represents setup time, focus adjustments, and handling delays - Understanding overhead helps optimize batch composition - Negative overhead would indicate super-linear efficiency gains
11.8 Correlation Analysis
Relationship between slide count and scan duration:
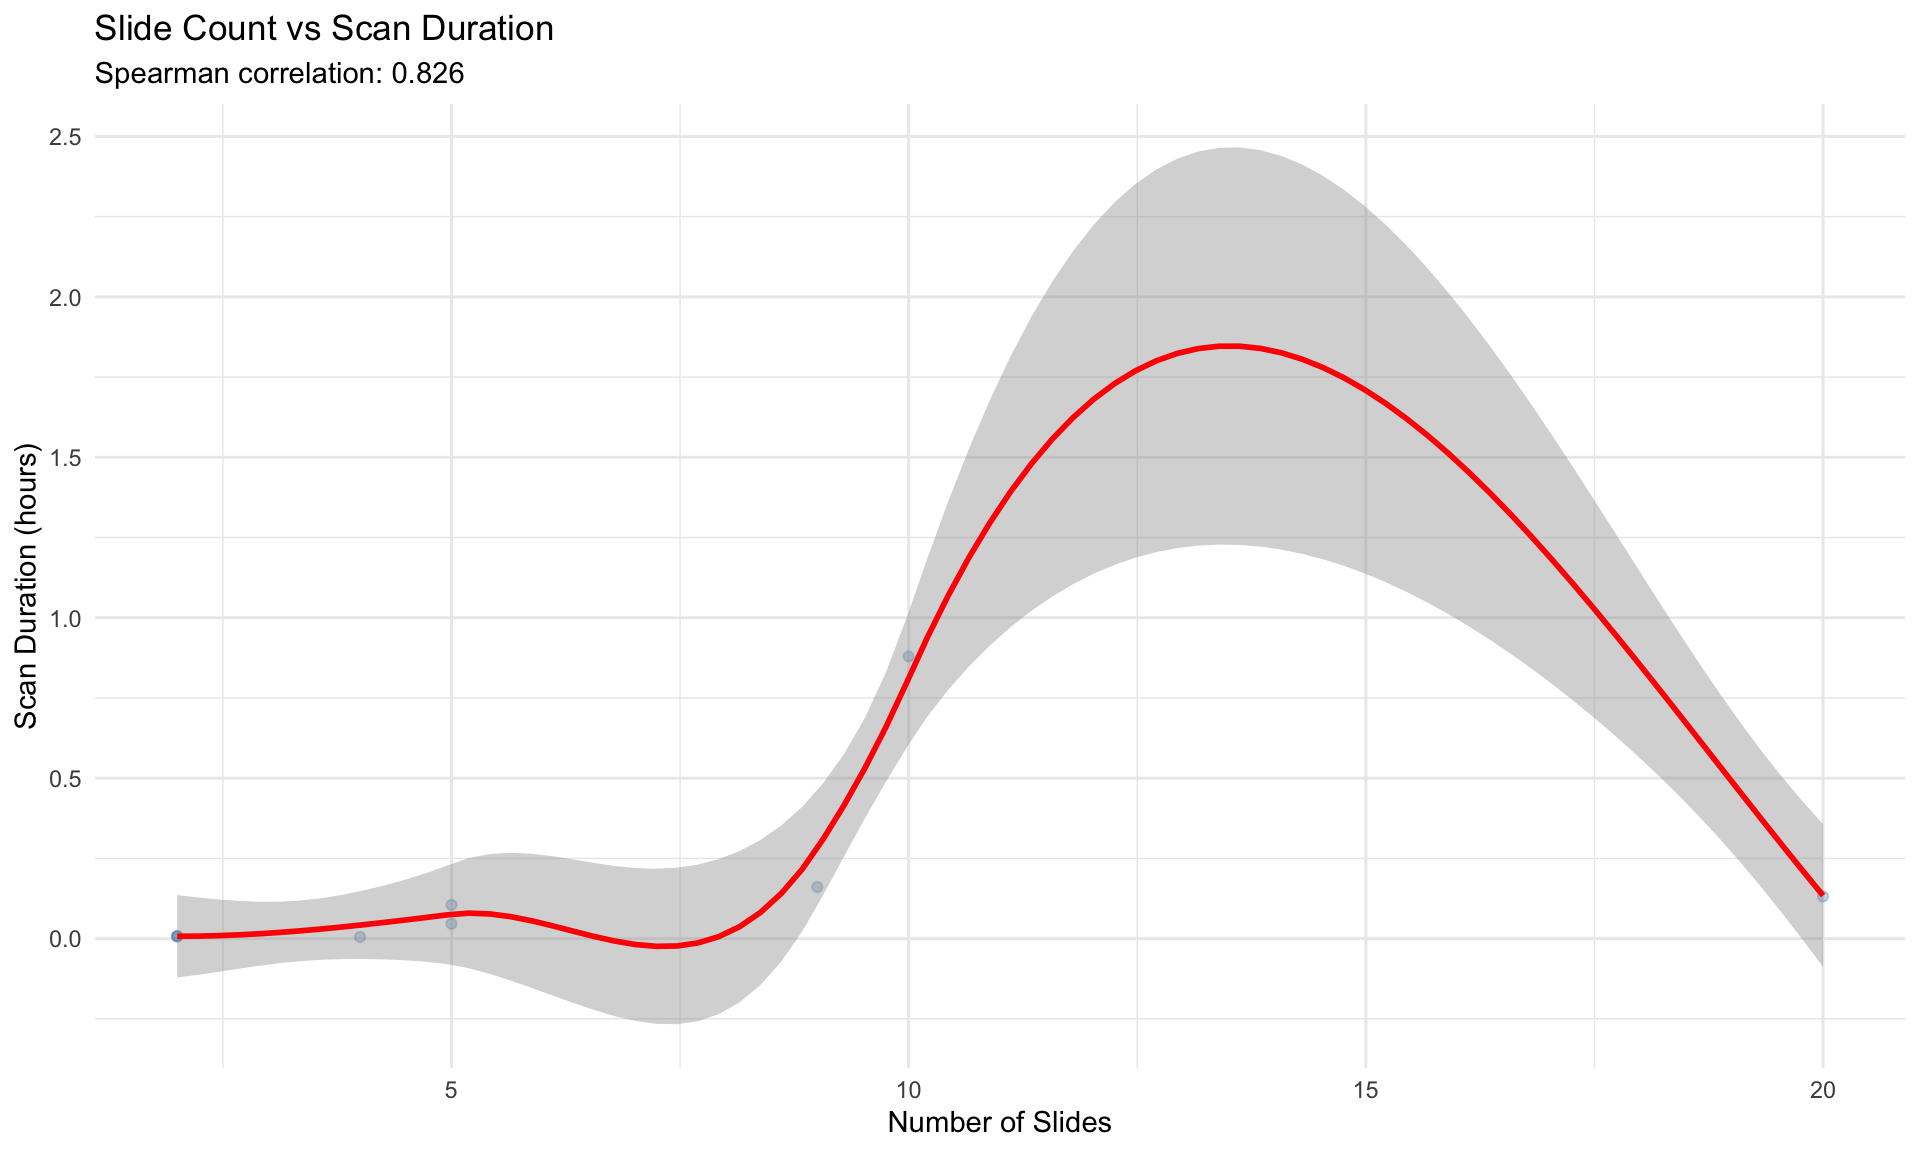
| Metric | Spearman's ρ |
|---|---|
| Scan Duration | 0.826 |
| Total TAT | 0.060 |
11.9 Clinical Implications
Understanding case complexity impact allows:
- Better TAT Predictions: Adjust expected completion times based on slide count
- Load Balancing: Distribute complex cases across scanners
- Priority Management: Fast-track simple cases during peak hours
- Capacity Planning: Calculate scanner requirements based on case mix
11.10 Recommendations
- Batch Optimization: Group similar-complexity cases for consistent throughput
- Priority Lanes: Create separate queues for single-slide urgent cases
- Staffing: Allocate more time for complex case loading and QC
- Predictive Scheduling: Use slide count to estimate scan completion time
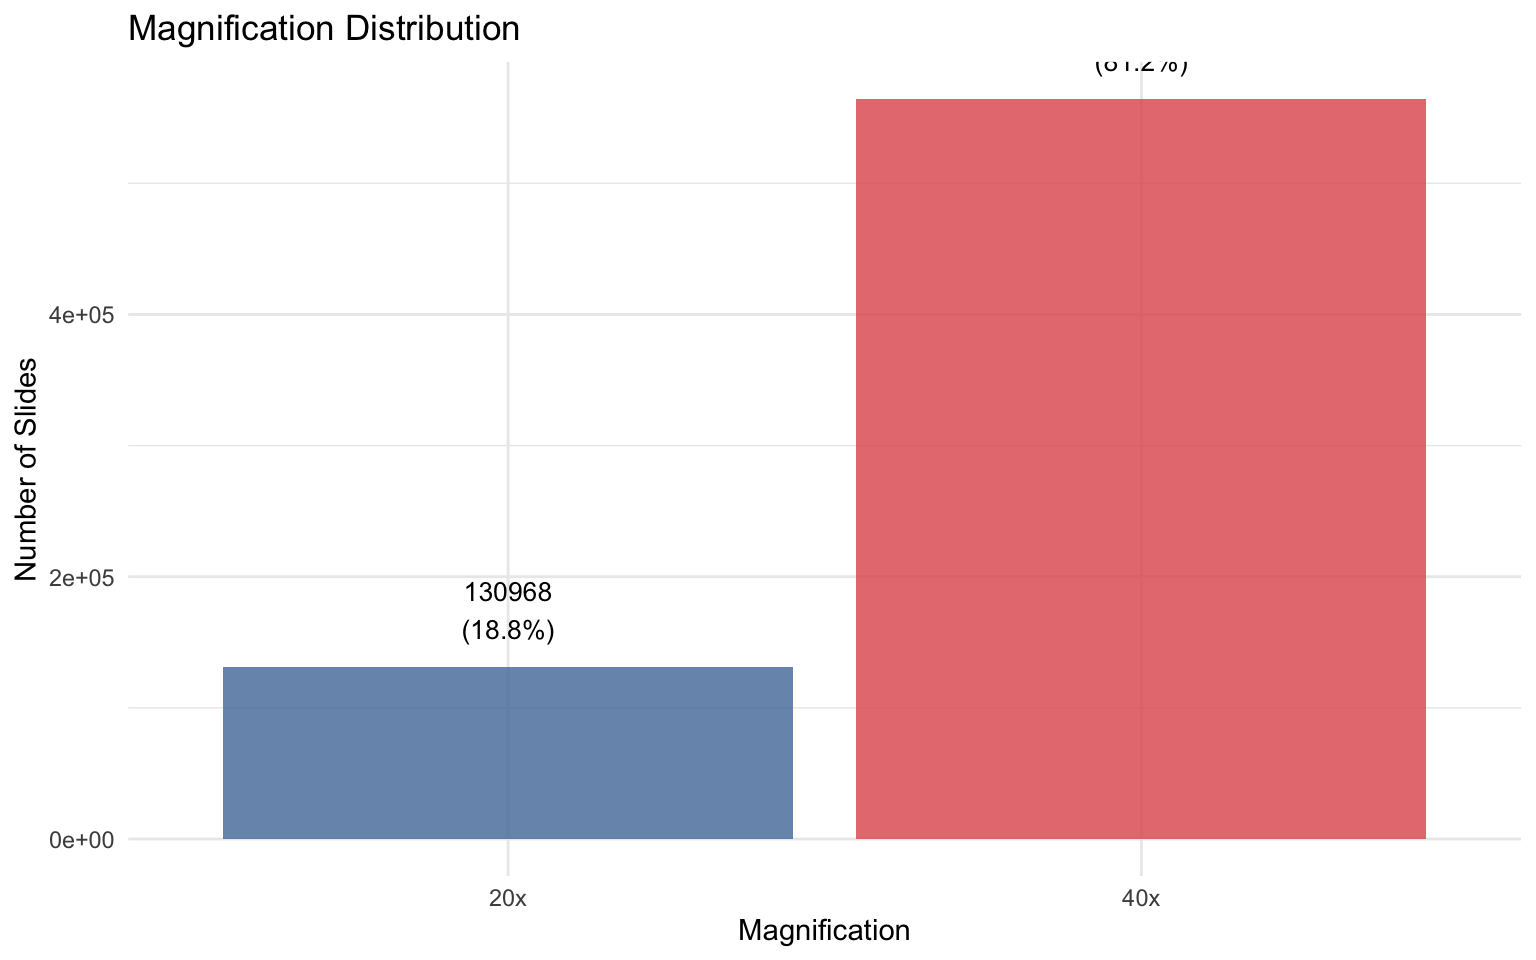
11.11 Magnification Impact Analysis (20x vs 40x)
Higher magnification scans (40x) produce larger file sizes, which may affect: - Scan Duration: More data to capture - Transfer Time: Larger files take longer to upload to PACS - Storage Requirements: Greater disk space needed
11.11.1 Magnification Distribution
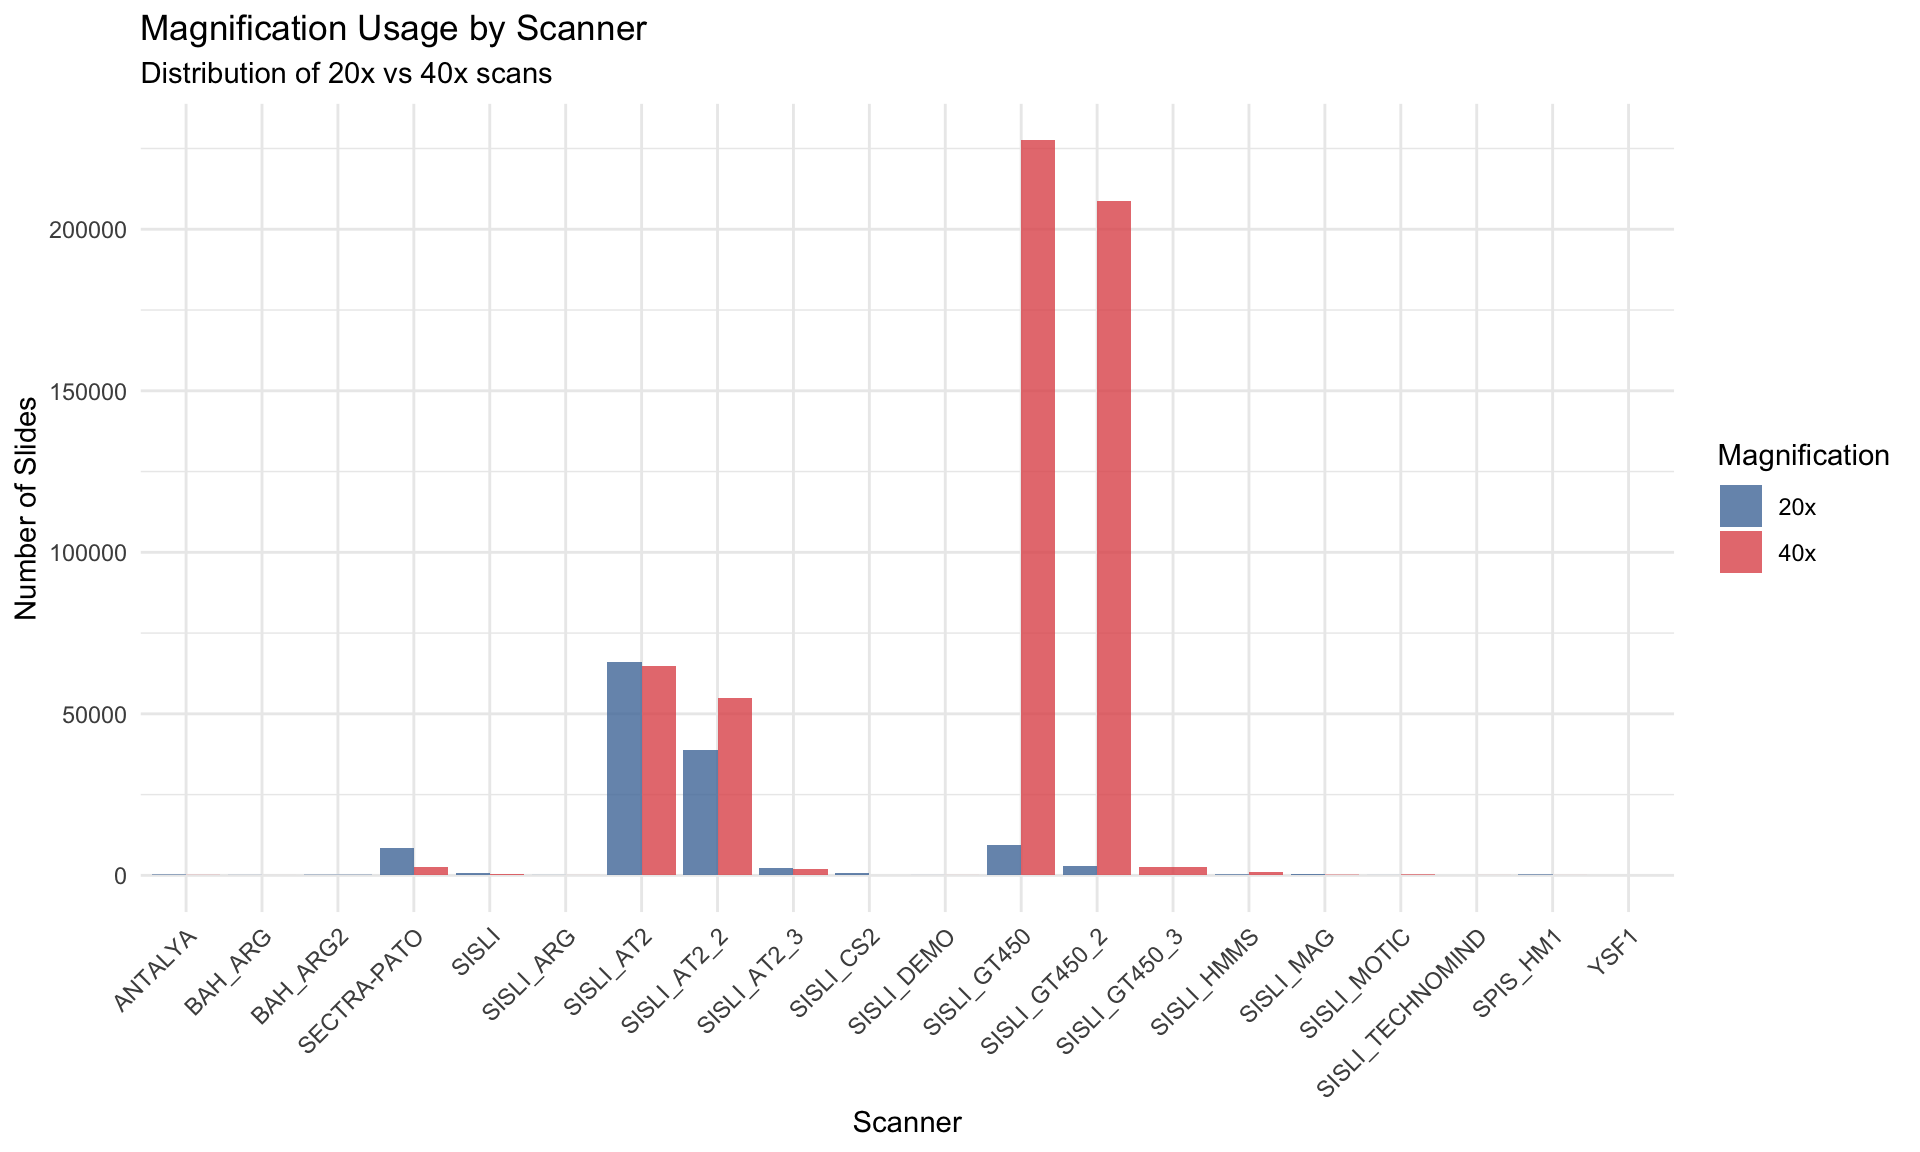
11.11.2 Magnification by Scanner
Different scanners may have different default magnification settings:
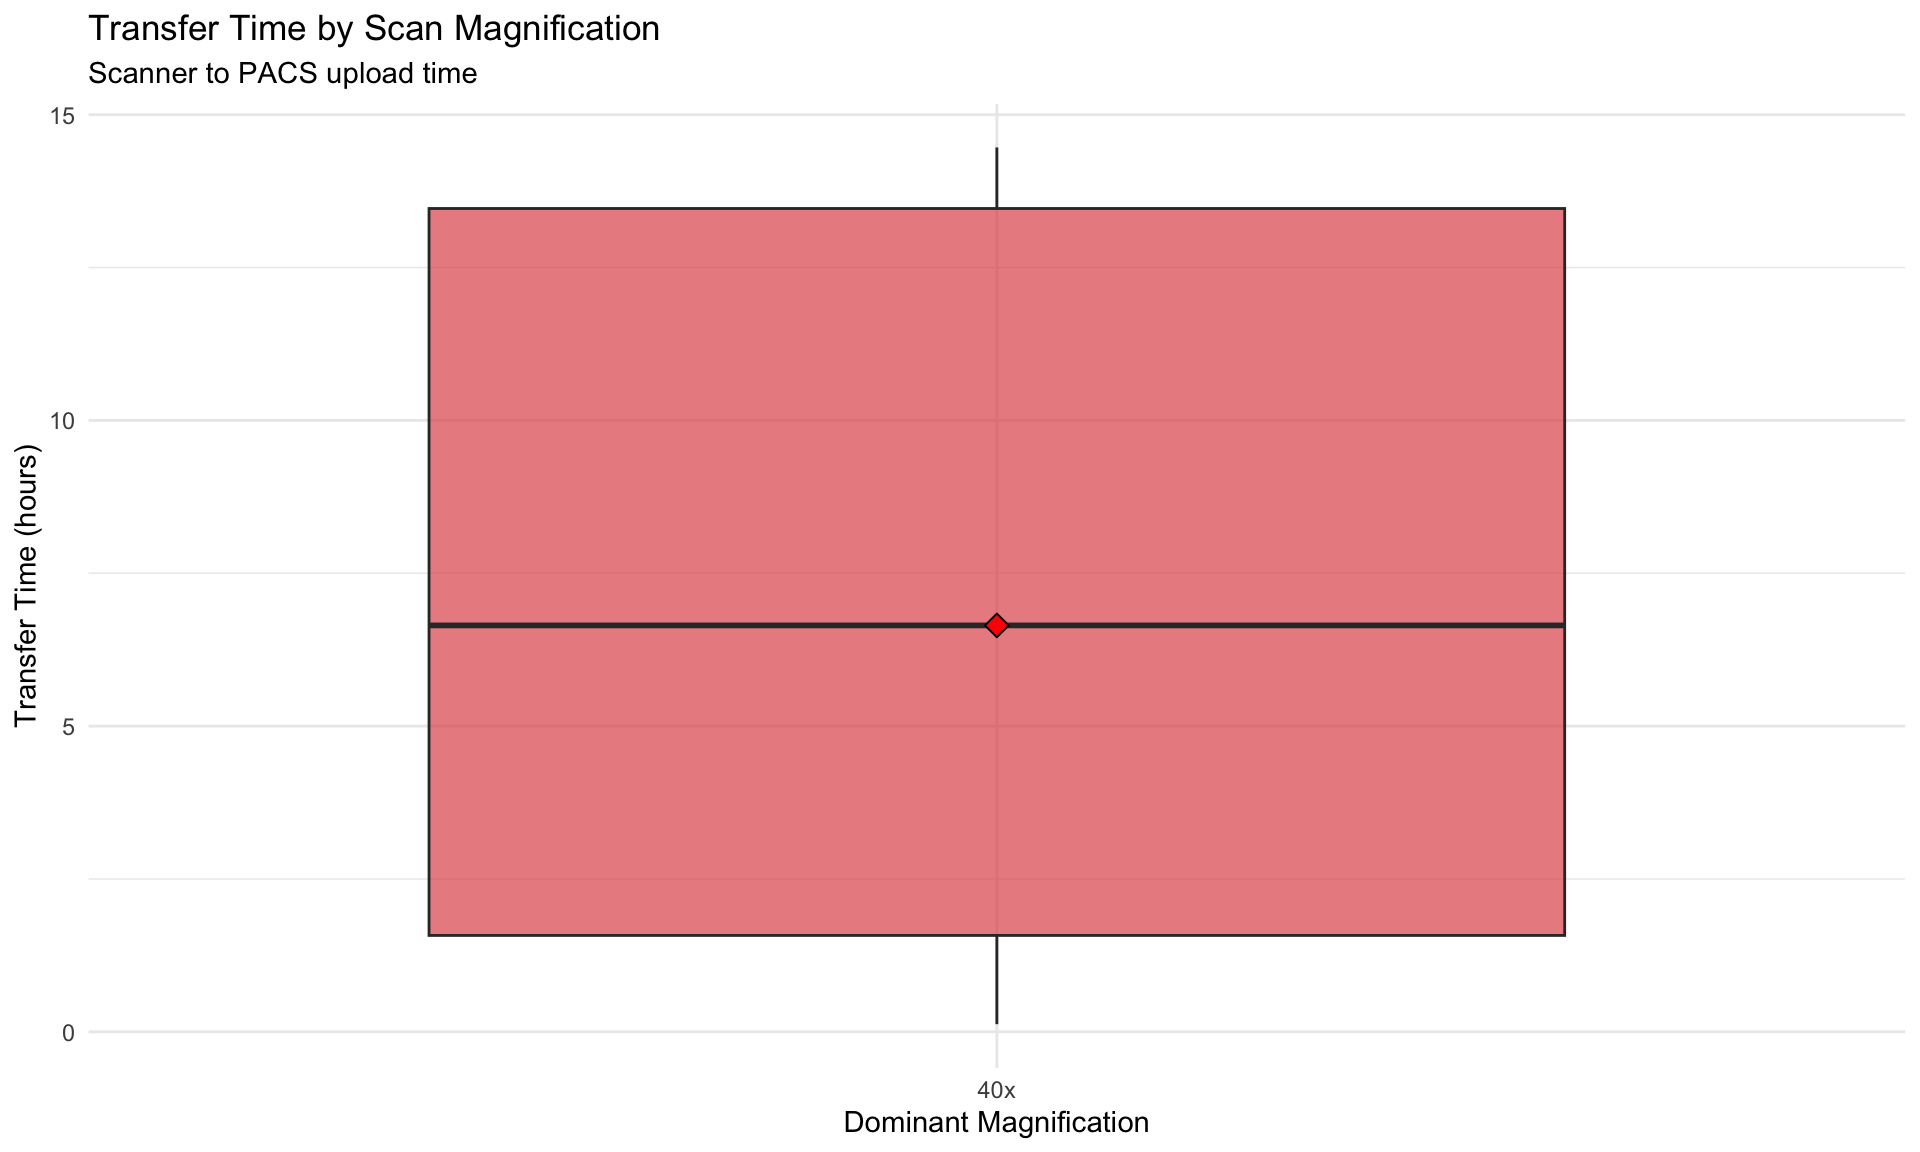
11.11.3 Impact on Transfer Time
Key Question: Does 40x scanning result in longer transfer times to PACS compared to 20x?
11.11.4 Clinical Implications
If 40x significantly increases transfer time: 1. Consider using 20x for routine H&E slides where high magnification is not critical 2. Schedule 40x scans during off-peak network hours 3. Prioritize 20x for urgent cases to minimize TAT
If no significant difference: - Magnification choice can be based purely on diagnostic needs without workflow concerns