6 Analyze Scanner Data
6.1 Introduction
This document focuses on the operational metrics of the scanner fleet. We analyze daily case volumes, workload distribution across devices, and identify specific bottlenecks in the scanning phase of the workflow.
6.2 Analysis
We load the analysis scripts and the processed data.
6.2.1 Daily Scanned Case Volume
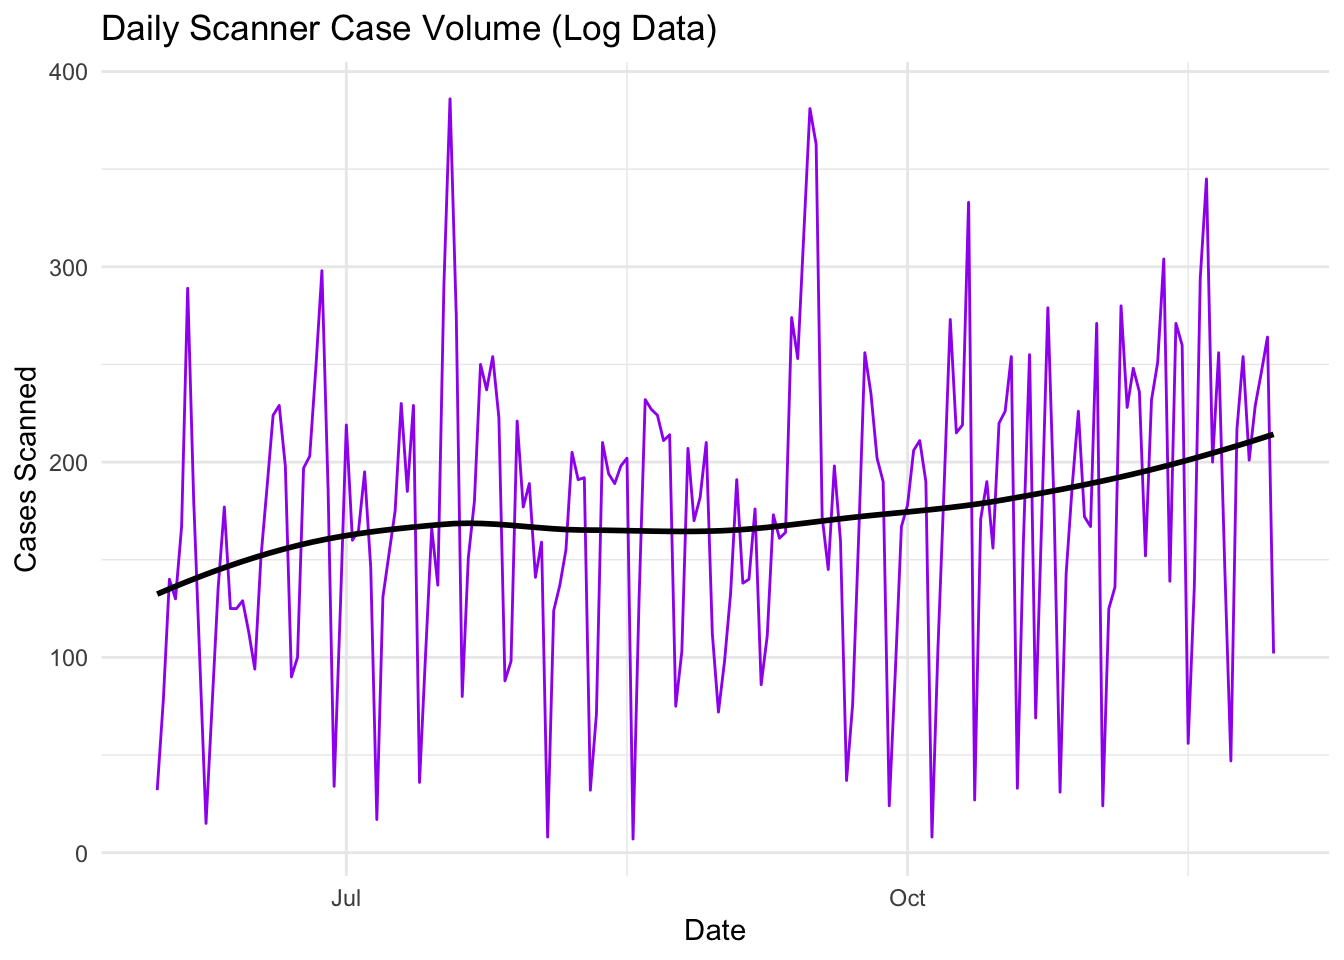
6.2.2 Daily Scanning Volume
The chart below illustrates the daily fluctuation in the number of cases scanned, providing insight into workload variability.
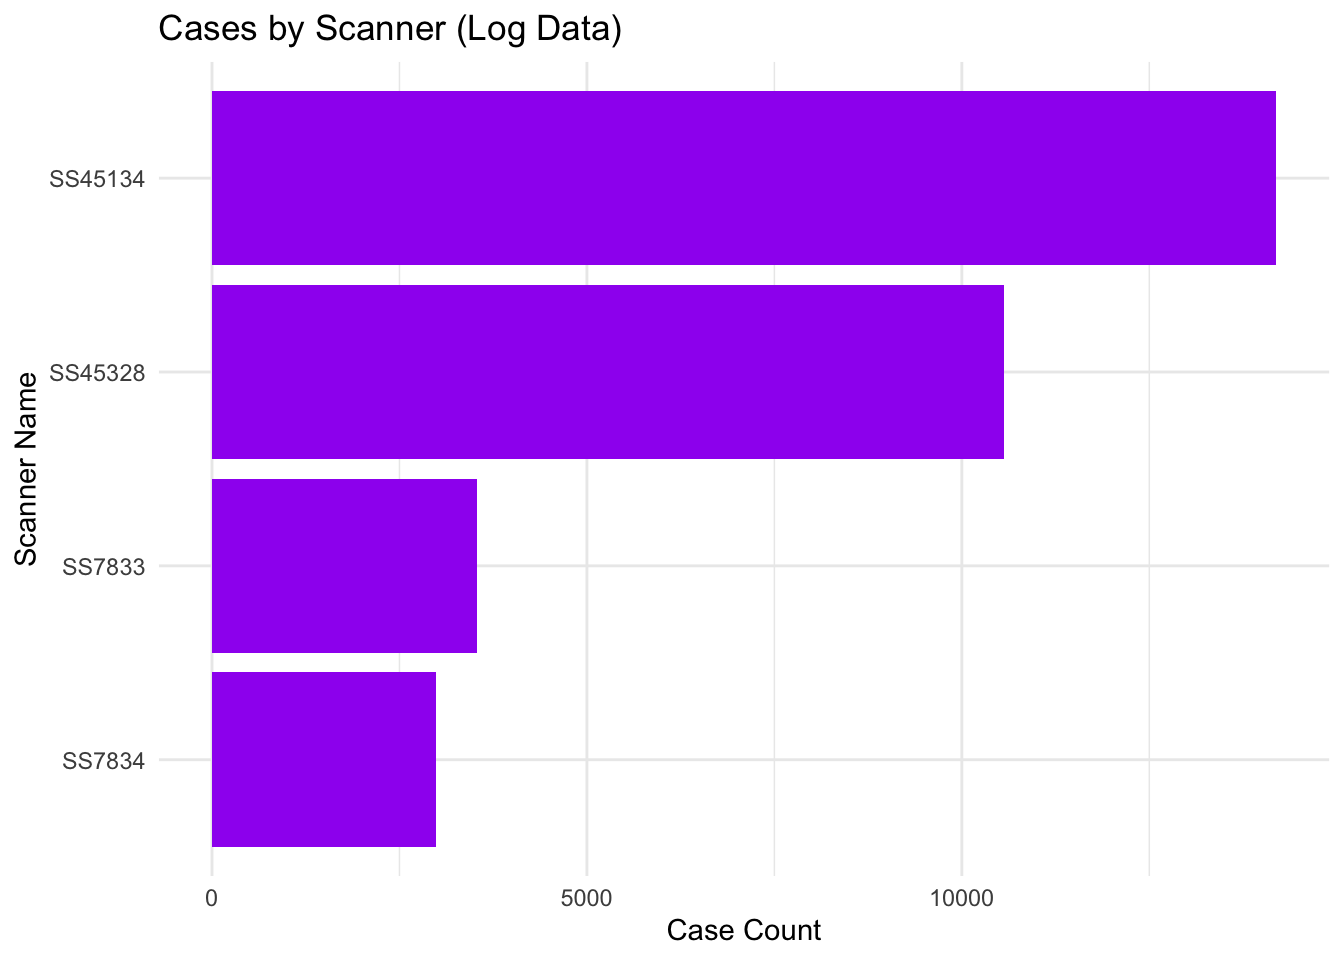
6.2.3 Scanner Workload Distribution
The following plot shows the number of cases processed by each scanner.
6.3 Descriptive Statistics
6.3.1 Overall Turnaround Times (Hours)
Summary statistics for key time intervals:
| Metric | Count | Mean | Median | SD | IQR | Min | Max |
|---|---|---|---|---|---|---|---|
| time_lab_to_scan | 47759 | 47.880320 | 13.5397222 | 449.285728 | 9.819792 | 0.1527778 | 11028.03417 |
| time_scan_duration | 47759 | 3.887475 | 0.1758333 | 21.929312 | 1.567708 | 0.0005556 | 963.46583 |
| time_scan_to_pacs | 47759 | 7.410216 | 6.6466667 | 6.013708 | 11.889722 | 0.1241667 | 14.46444 |
| time_total_turnaround | 47759 | 16.688969 | 8.0463889 | 133.021387 | 10.841869 | 0.0005556 | 9069.37917 |
6.3.2 Turnaround by Category
Average turnaround time broken down by category:
| turnaround_category | case_count | percentage | time_total_turnaround_mean | time_total_turnaround_median |
|---|---|---|---|---|
| 24-72h | 1823 | 3.82 | 34.465679 | 30.613889 |
| 3-7 Days | 288 | 0.60 | 106.172390 | 100.692963 |
| Extreme (>7 Days) | 171 | 0.36 | 772.398640 | 269.592702 |
| Unknown | 22874 | 47.89 | NaN | NA |
| Within 24h | 22603 | 47.33 | 8.397834 | 7.117757 |
6.3.3 Turnaround by Day of Week
Average turnaround time based on the day the lab work was finished:
| Day | Count | Mean_Total_Time | Median_Total_Time |
|---|---|---|---|
| Mon | 8090 | 11.53912 | 6.589444 |
| Tue | 7765 | 15.97077 | 8.390833 |
| Wed | 7657 | 18.19863 | 8.435036 |
| Thu | 8270 | 19.58382 | 8.651528 |
| Fri | 8835 | 16.81135 | 9.242348 |
| Sat | 7142 | 18.73411 | 7.179306 |
6.4 Insights
6.4.1 Bottleneck Analysis
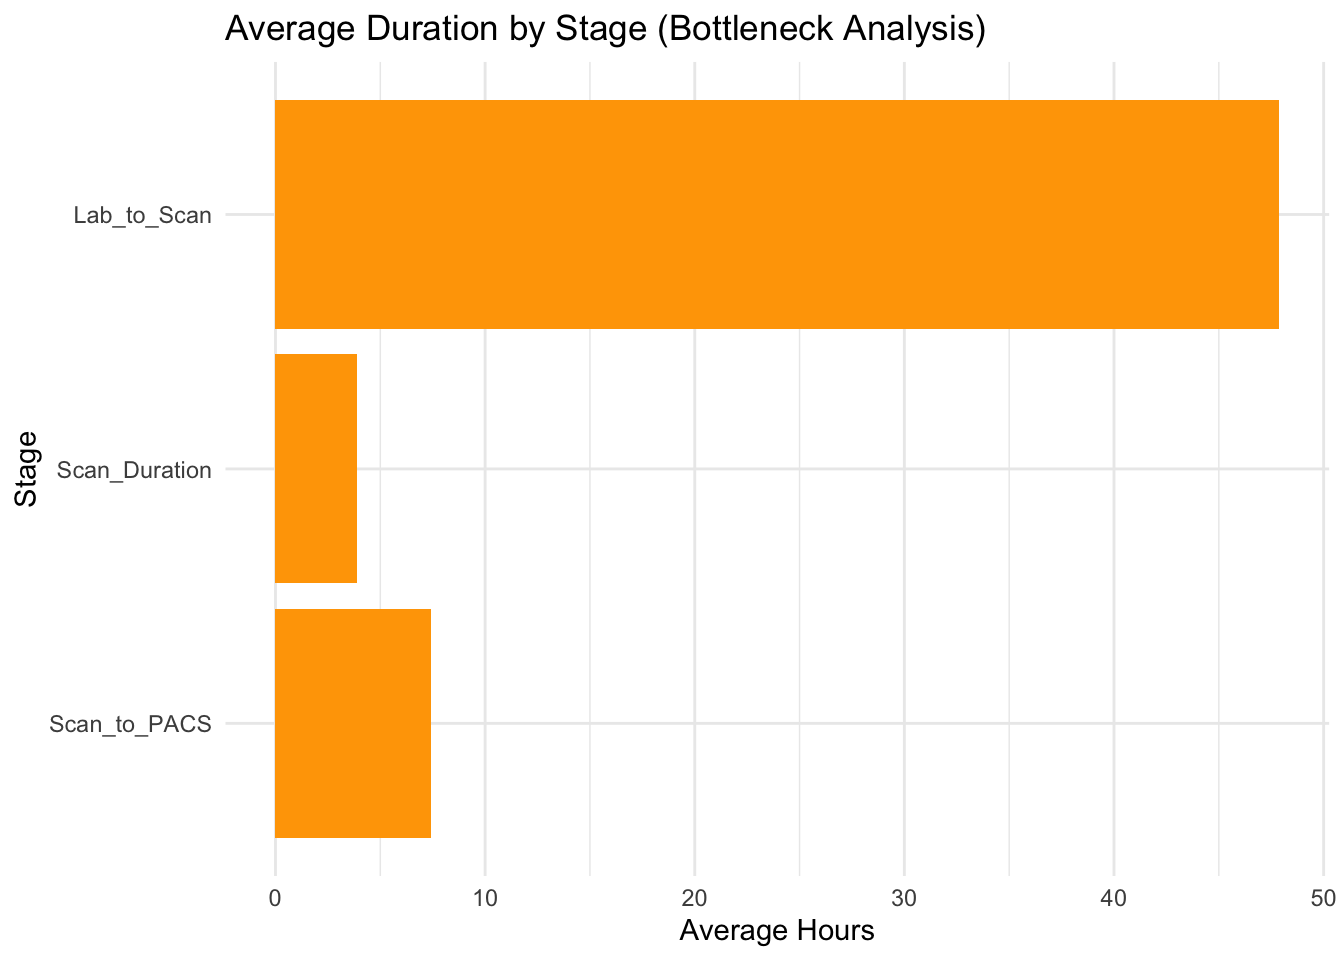
We analyze the average duration of each stage to identify bottlenecks.
| Stage | Avg_Hours |
|---|---|
| Lab_to_Scan | 47.880320 |
| Scan_to_PACS | 7.410216 |
| Scan_Duration | 3.887475 |
6.4.2 Outlier Analysis
The top 10 slowest cases:
| erisim_numarasi | time_total_turnaround | turnaround_category | lab_finish_time |
|---|---|---|---|
| 25912-24 | 9069.379 | Extreme (>7 Days) | 2024-05-16 19:21:43 |
| 17452-24 | 9047.015 | Extreme (>7 Days) | 2024-03-30 11:13:29 |
| 29817-24 | 7274.255 | Extreme (>7 Days) | 2024-06-05 12:51:36 |
| 19808-24 | 5660.178 | Extreme (>7 Days) | 2024-04-18 15:12:18 |
| 17111-24 | 4932.043 | Extreme (>7 Days) | 2024-03-28 15:00:24 |
| 17957-24 | 4809.034 | Extreme (>7 Days) | 2024-04-02 15:26:47 |
| 33794-24 | 4514.571 | Extreme (>7 Days) | 2024-06-29 11:29:30 |
| 79-25 | 3454.276 | Extreme (>7 Days) | 2025-01-03 11:16:50 |
| 46065-24 | 3256.301 | Extreme (>7 Days) | 2024-09-04 14:17:54 |
| 58143-24 | 3190.244 | Extreme (>7 Days) | 2024-11-06 12:41:31 |
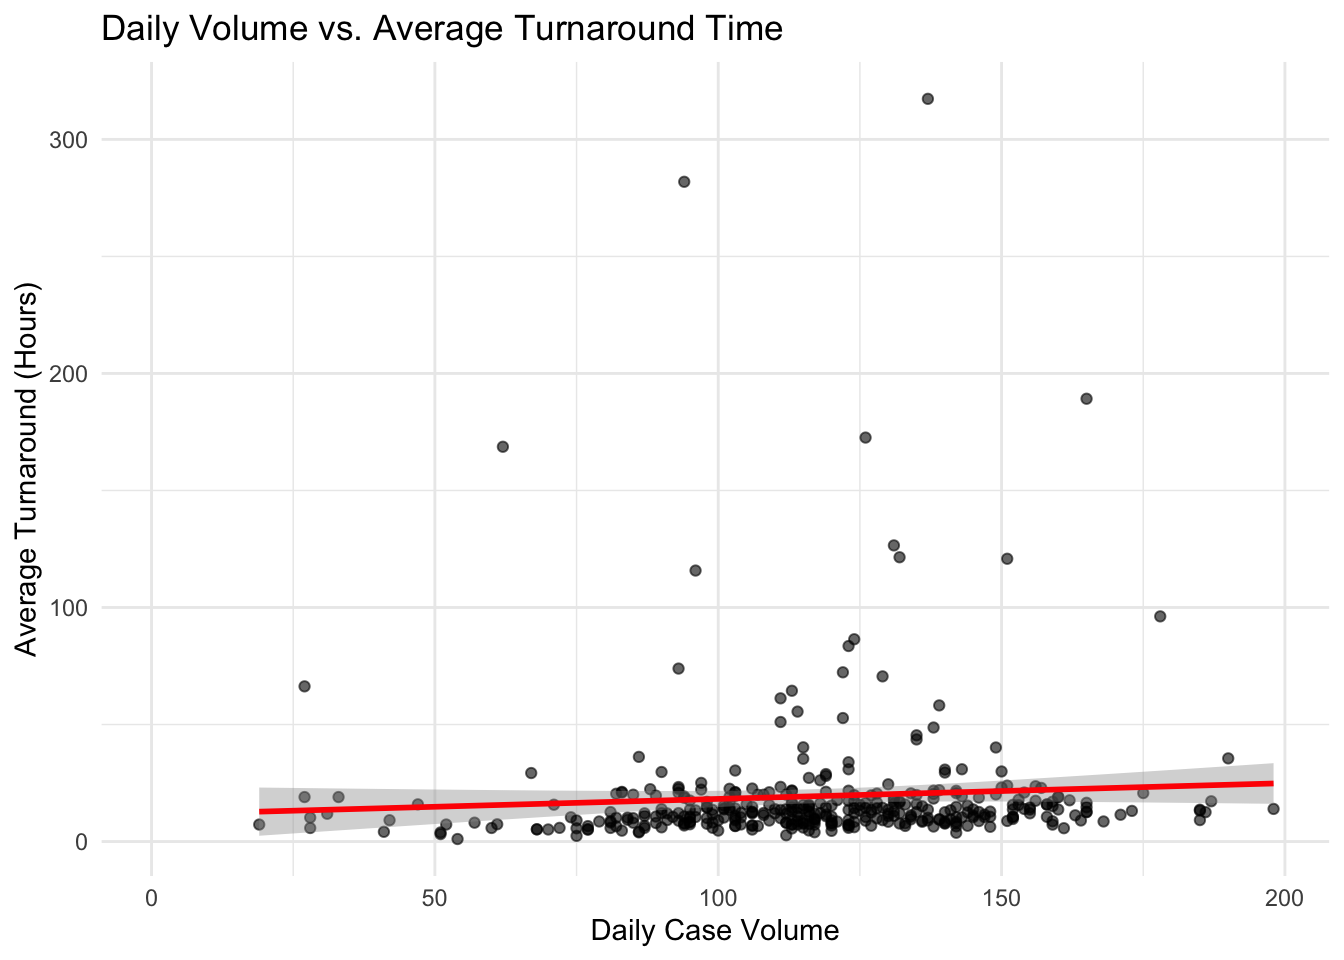
6.4.3 Volume vs. Turnaround Correlation
Is there a correlation between daily case volume and turnaround time?
6.4.4 Correlation Statistics
| Metric | Correlation_Coefficient | P_Value | |
|---|---|---|---|
| cor…1 | Volume vs Turnaround | 0.067 | 0.189 |
| cor…2 | Volume vs Turnaround (Clean) | 0.234 | 4.67e-06 |
6.4.5 Analysis Excluding Outliers
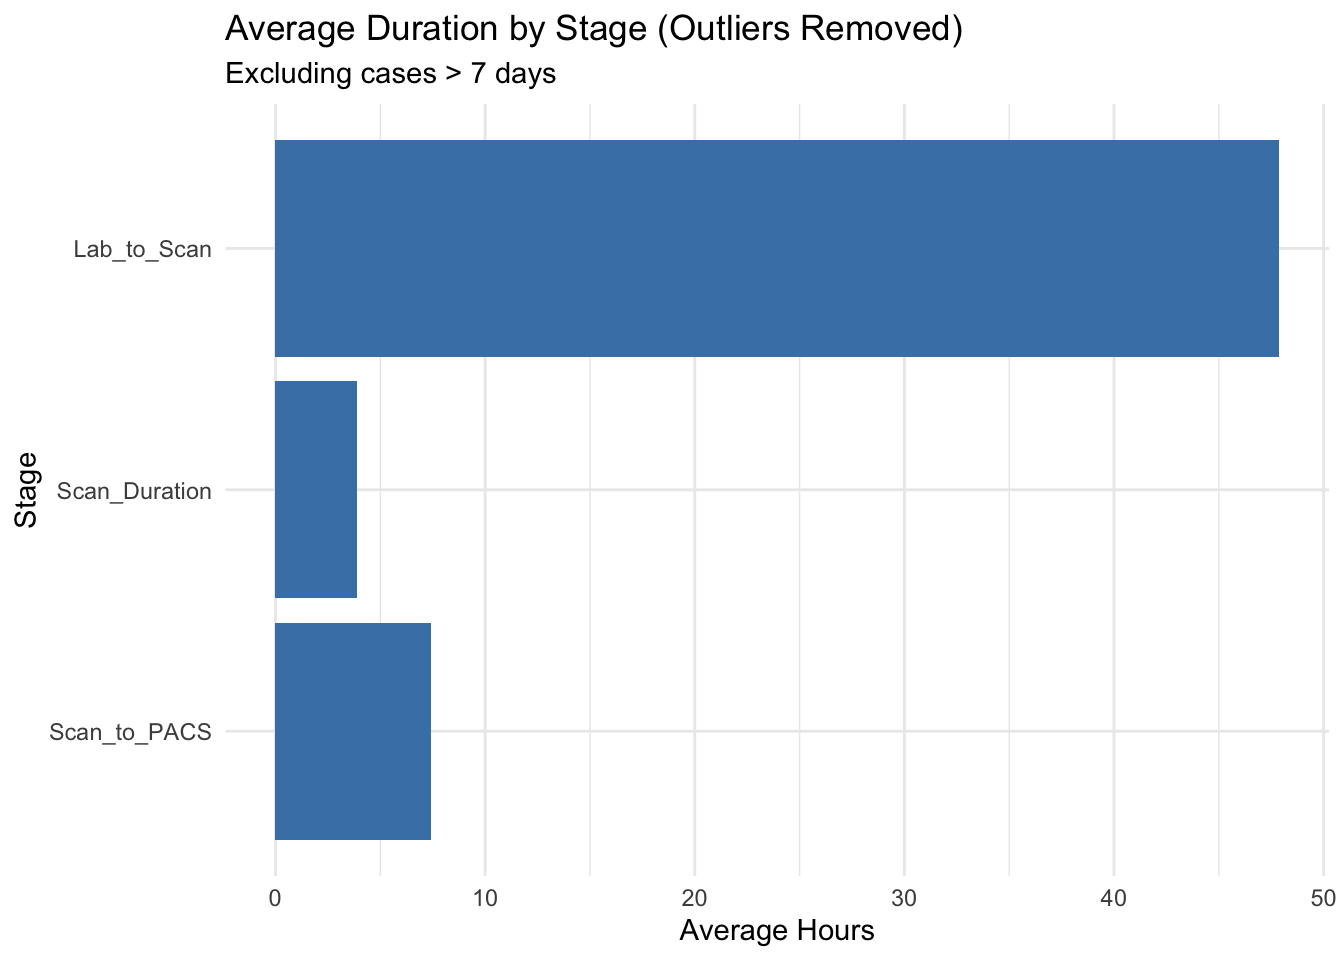
To understand the “routine” workflow performance, we repeated the bottleneck analysis after excluding extreme outliers (>7 days).
6.4.6 Rescan Rate Analysis (Barcode-Based)
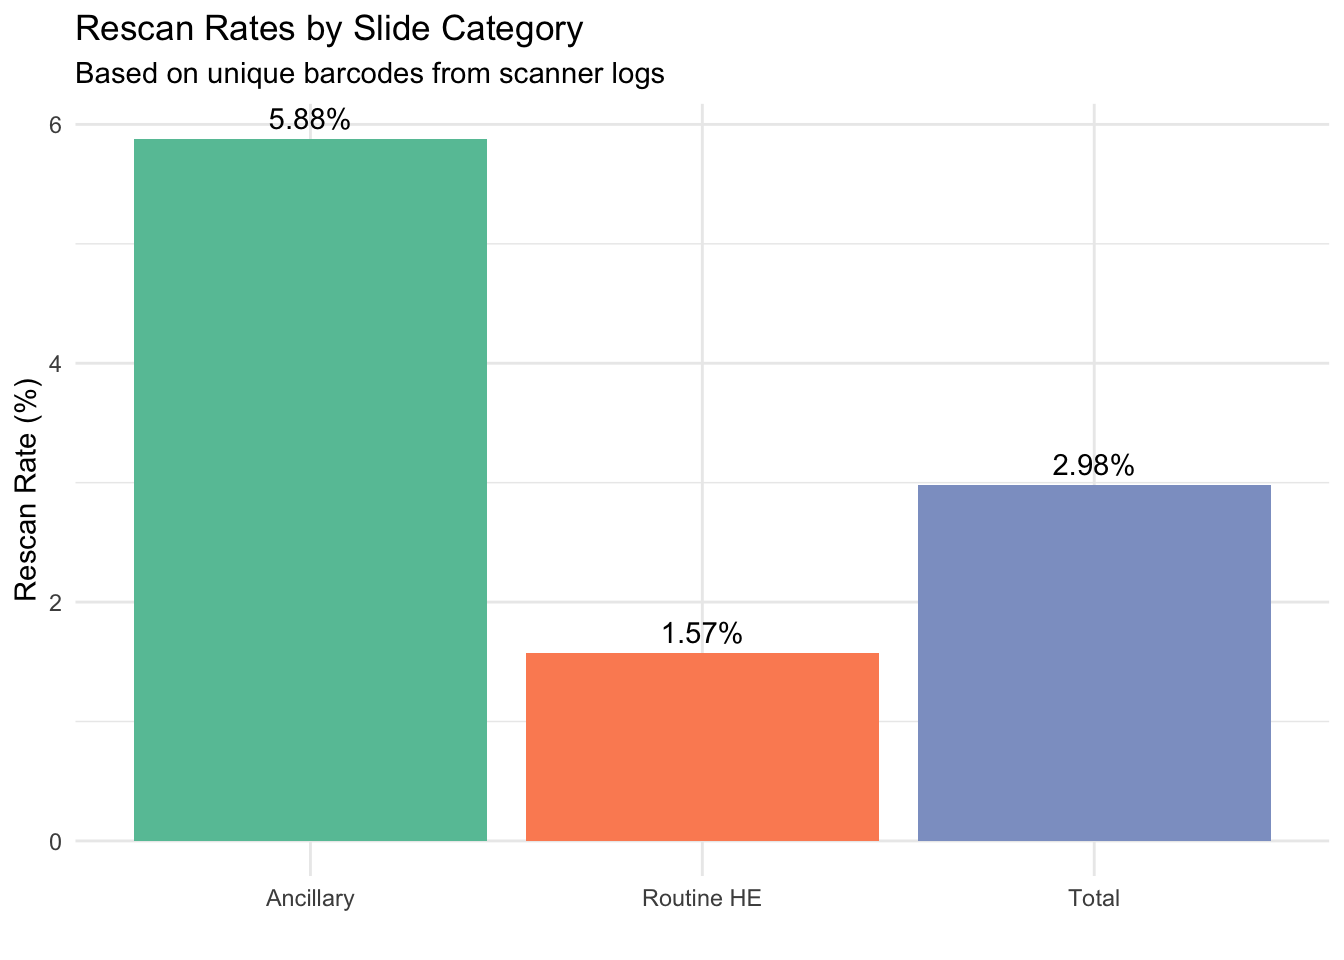
We analyzed rescan rates by extracting unique barcodes from scanner logs. A rescan is defined as the same barcode appearing in multiple scan events (different rack/slot).
| Category | Total_Unique_Slides | Rescanned_Slides | Rescan_Rate_Percent |
|---|---|---|---|
| Total | 195989 | 5838 | 2.98 |
| Routine HE | 131745 | 2063 | 1.57 |
| Ancillary | 64244 | 3775 | 5.88 |