| Stage | Median Time (hrs) | Mean Time (hrs) | % of Total TAT |
|---|---|---|---|
| Lab to Scanner | 7.53 | 11.44 | 54.63 |
| Scanner to PACS | 6.65 | 7.41 | 44.00 |
| Scanning | 0.05 | 0.15 | 1.37 |
13 Bottleneck Identification Analysis
13.1 Introduction
In any multi-stage process, the bottleneck is the stage that limits overall throughput. Identifying and addressing bottlenecks is the most effective way to improve system performance.
13.1.1 Theory of Constraints
Key principles: 1. System Output is limited by its constraint (bottleneck) 2. Improving non-constraints doesn’t increase throughput 3. Focus efforts on the constraint to maximize impact 4. After fixing one constraint, another becomes the new bottleneck
This analysis identifies: - Which workflow stage is the primary constraint - How much time each stage contributes to total TAT - Where improvement efforts should focus
13.2 Load Data and Run Analysis
Analysis includes 9 cases with complete timing data across all stages.
13.3 Stage Contribution to Total TAT
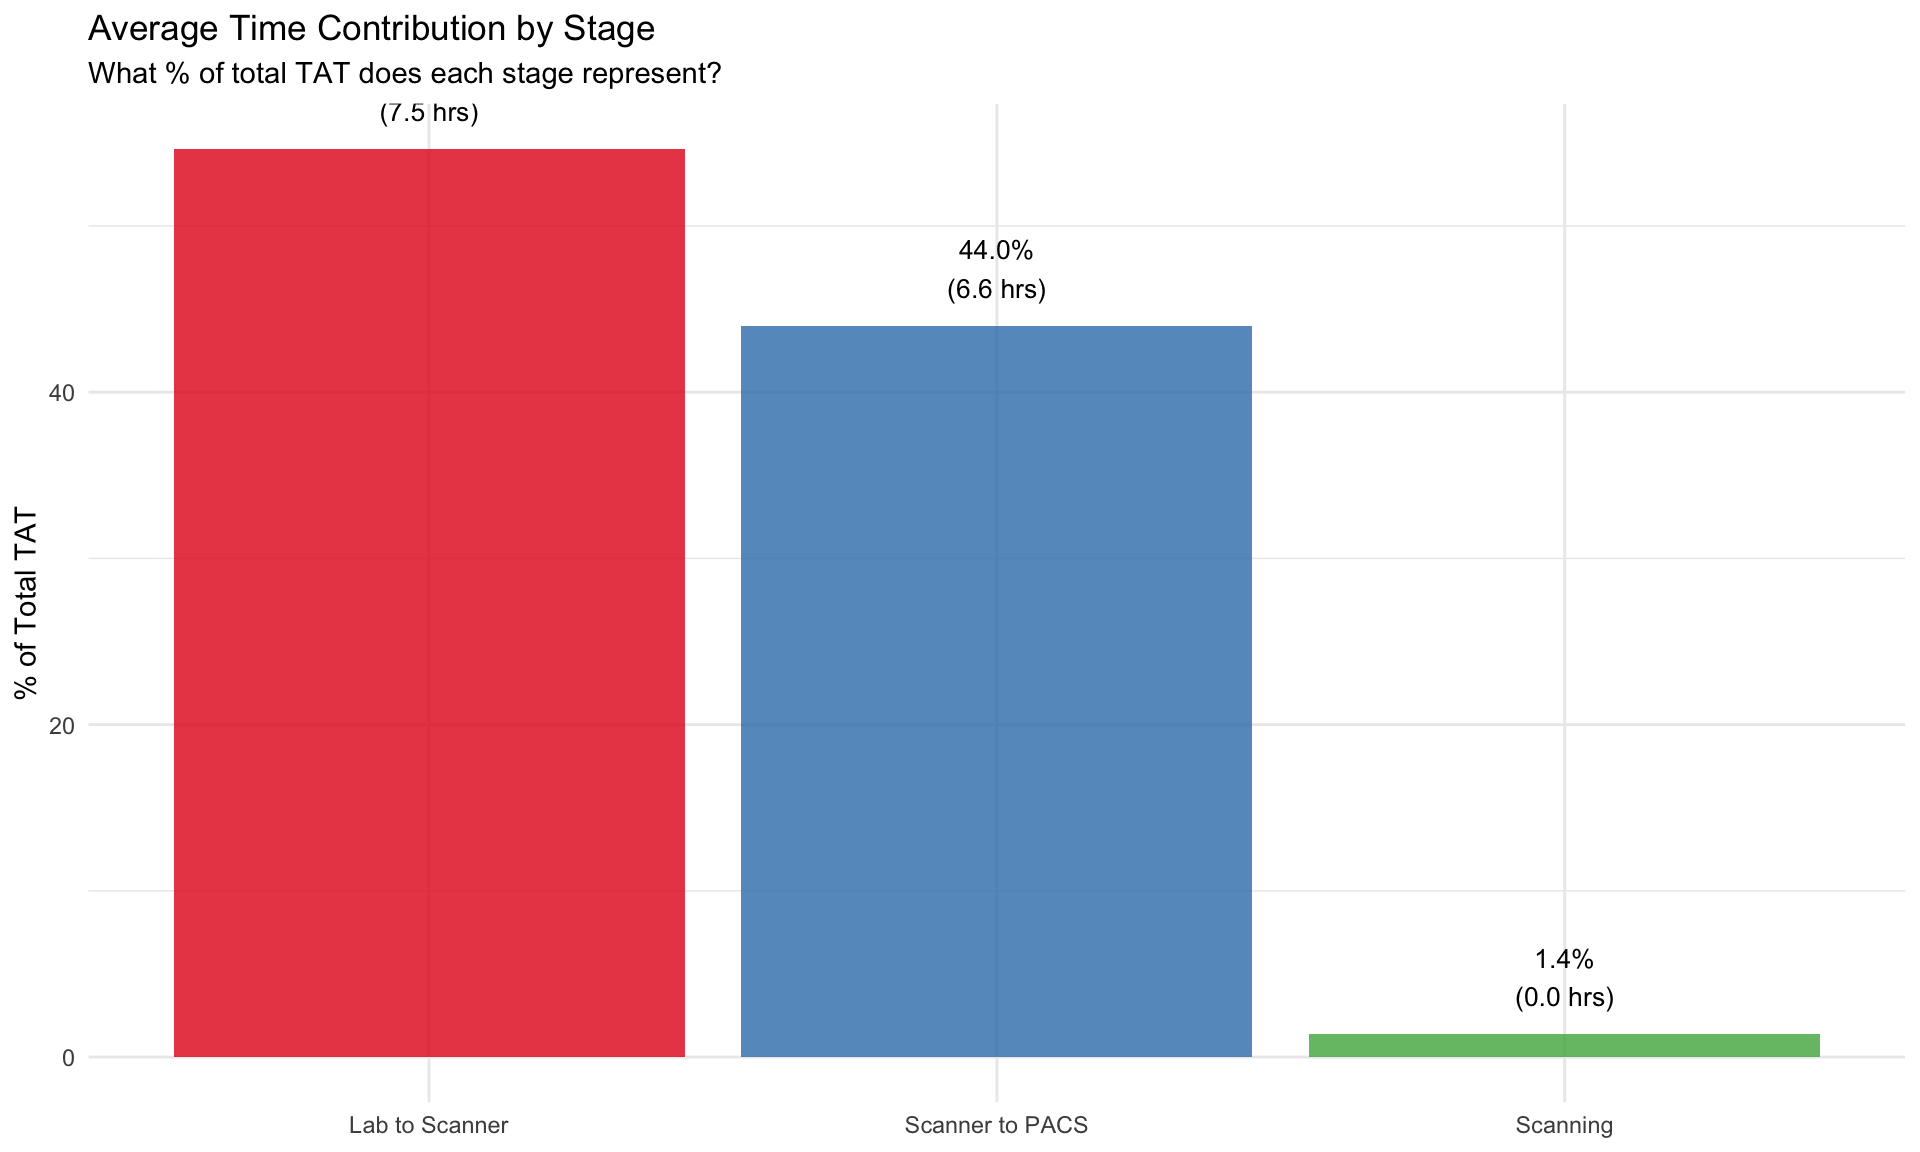
Key Question: Which stage dominates total turnaround time?
13.4 Bottleneck Distribution
For each case, we identify which single stage took the longest time:
| Bottleneck Stage | Cases | % of Cases | Avg Total TAT (hrs) | Median Total TAT (hrs) |
|---|---|---|---|---|
| Lab to Scanner | 5 | 55.56 | 21.76 | 19.41 |
| Scanner to PACS | 4 | 44.44 | 15.54 | 20.08 |
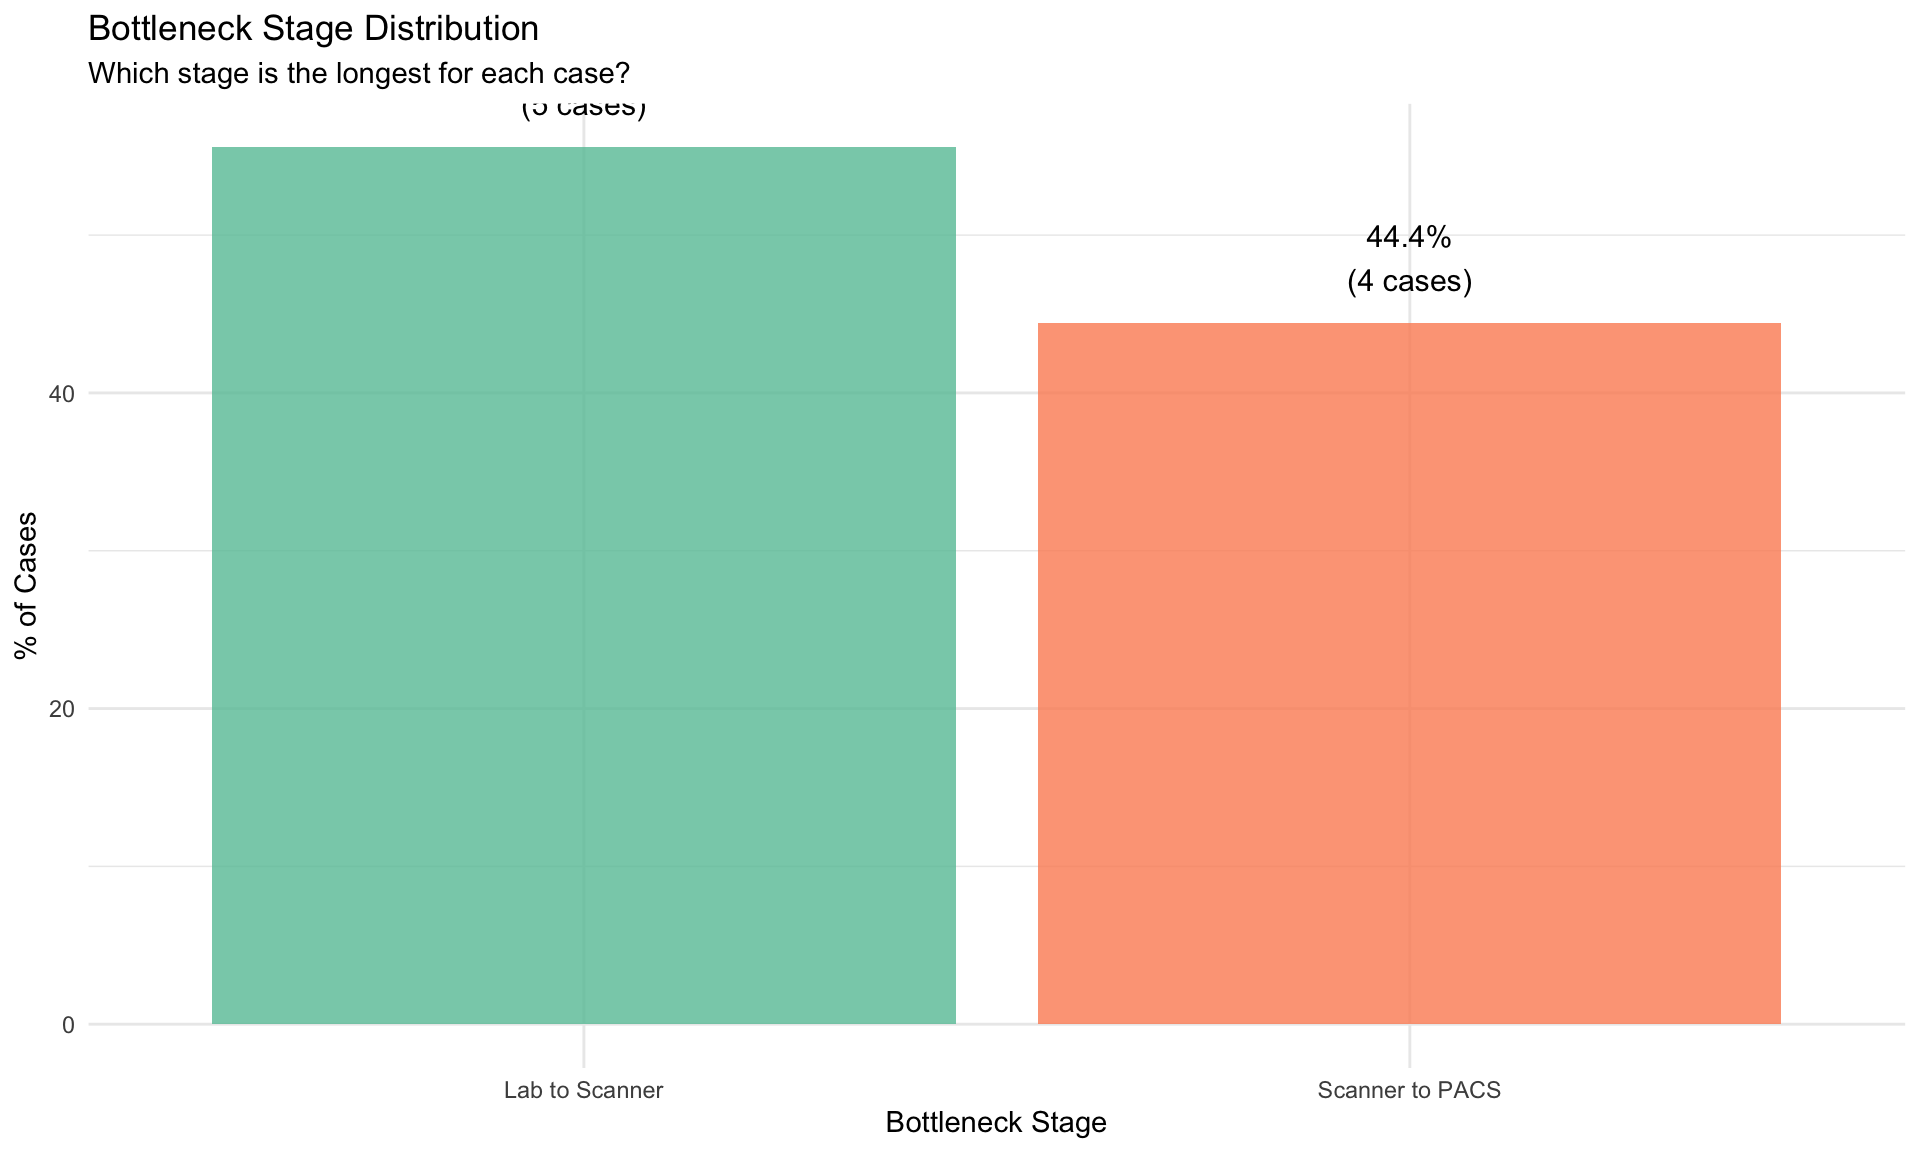
Interpretation: - If Lab to Scanner dominates: Queue management issue - If Scanning dominates: Capacity constraint (need more scanners or better efficiency) - If Scanner to PACS dominates: Network or upload bottleneck
13.5 Time Distribution by Stage
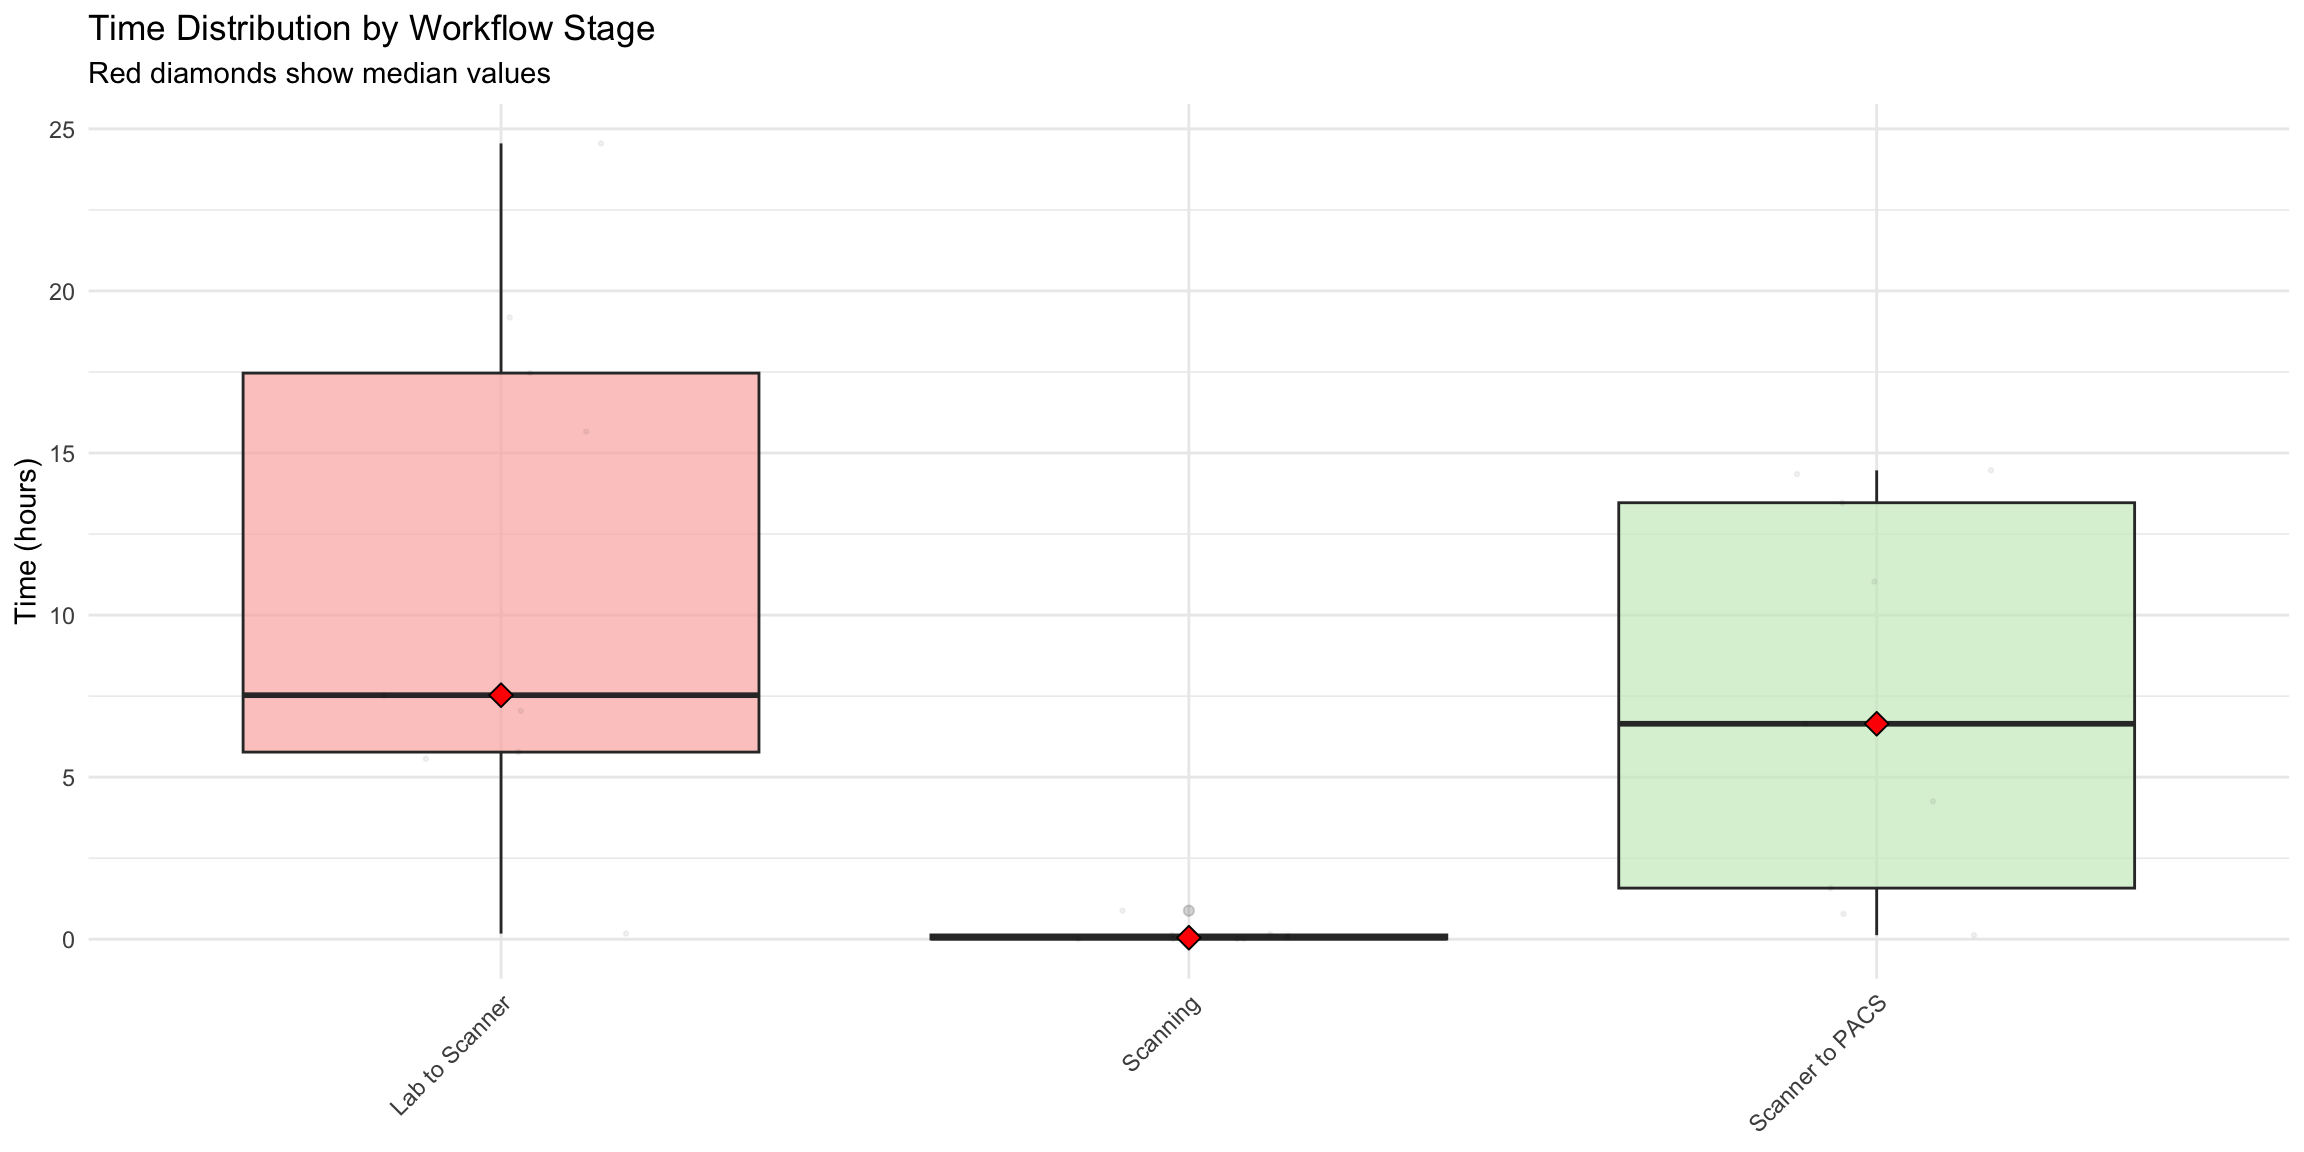
Analysis Points: - Compare median values (red diamonds) across stages - Identify stages with high variability (tall boxes) - Outliers indicate process inconsistencies
13.6 Critical Path Analysis
How do delays accumulate in different TAT categories?
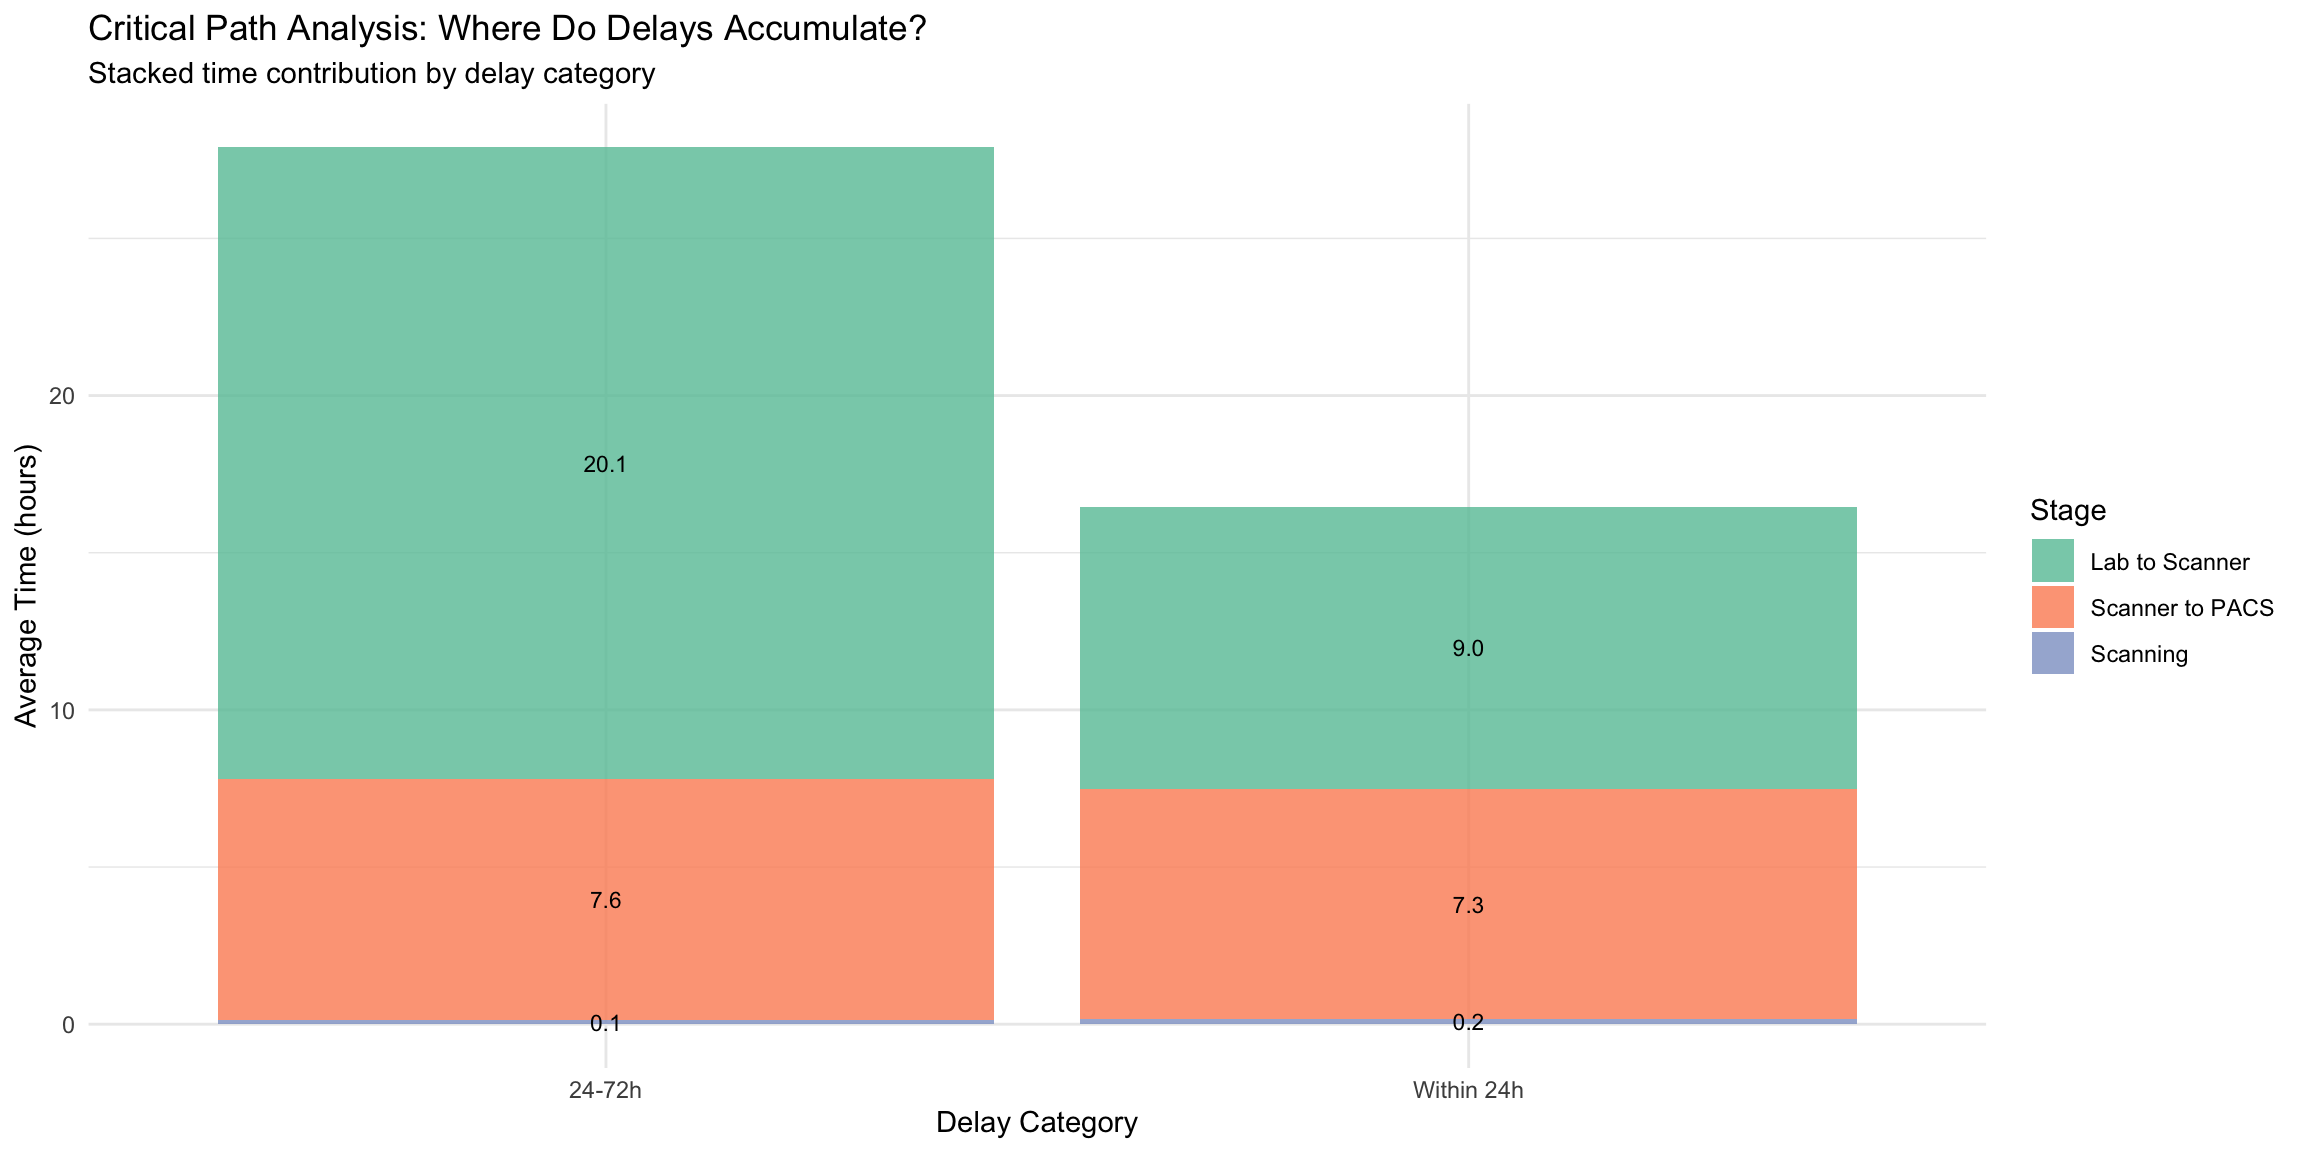
Strategic Insight: - For cases within 24h: Which stage is still significant? - For delayed cases (>72h): Which stage contributes most to extreme delays? - Focus improvement efforts on stages that worsen with delays
13.7 Waterfall Chart: TAT Buildup
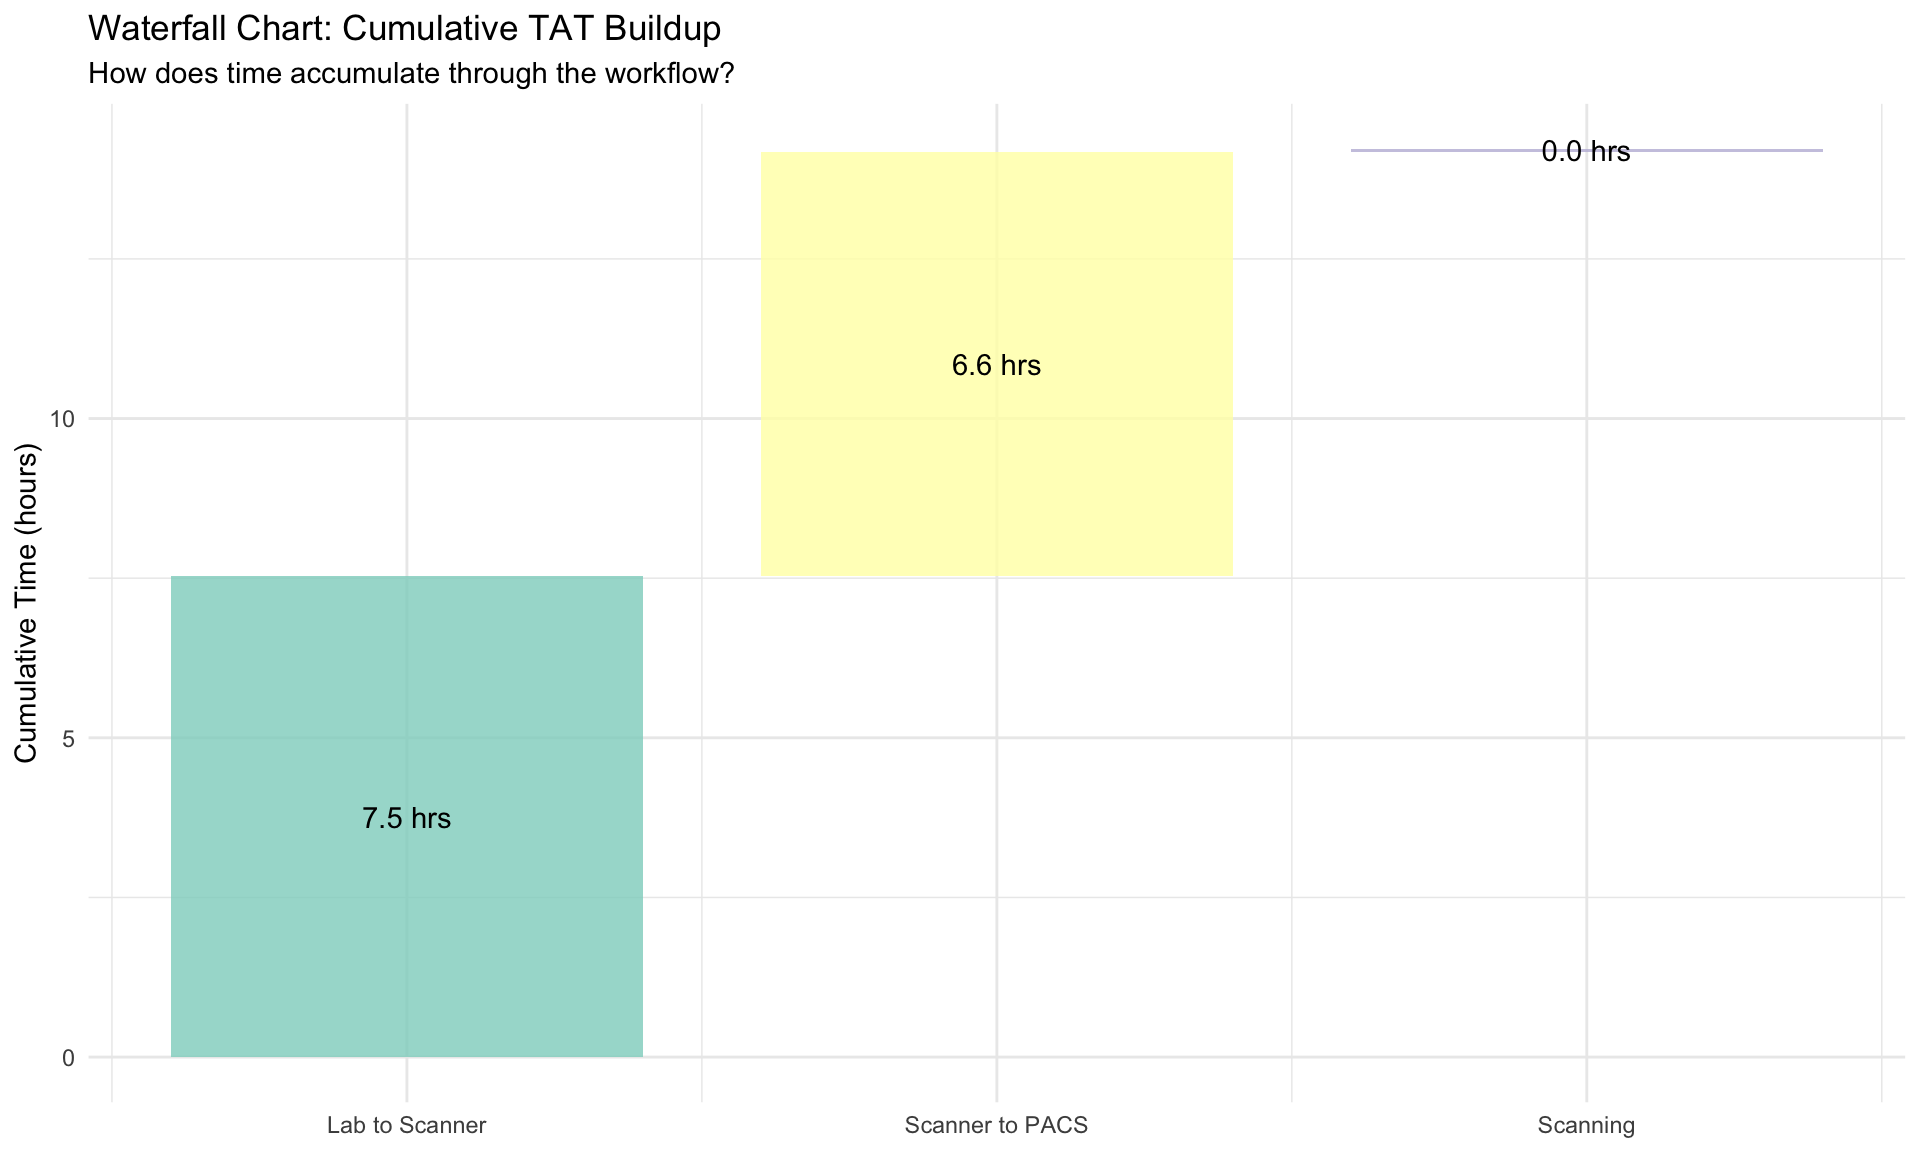
Visualization shows: - Sequential accumulation of time through workflow - Relative magnitude of each stage’s contribution - Final total TAT as sum of all stages
13.8 Pareto Analysis: 80/20 Rule
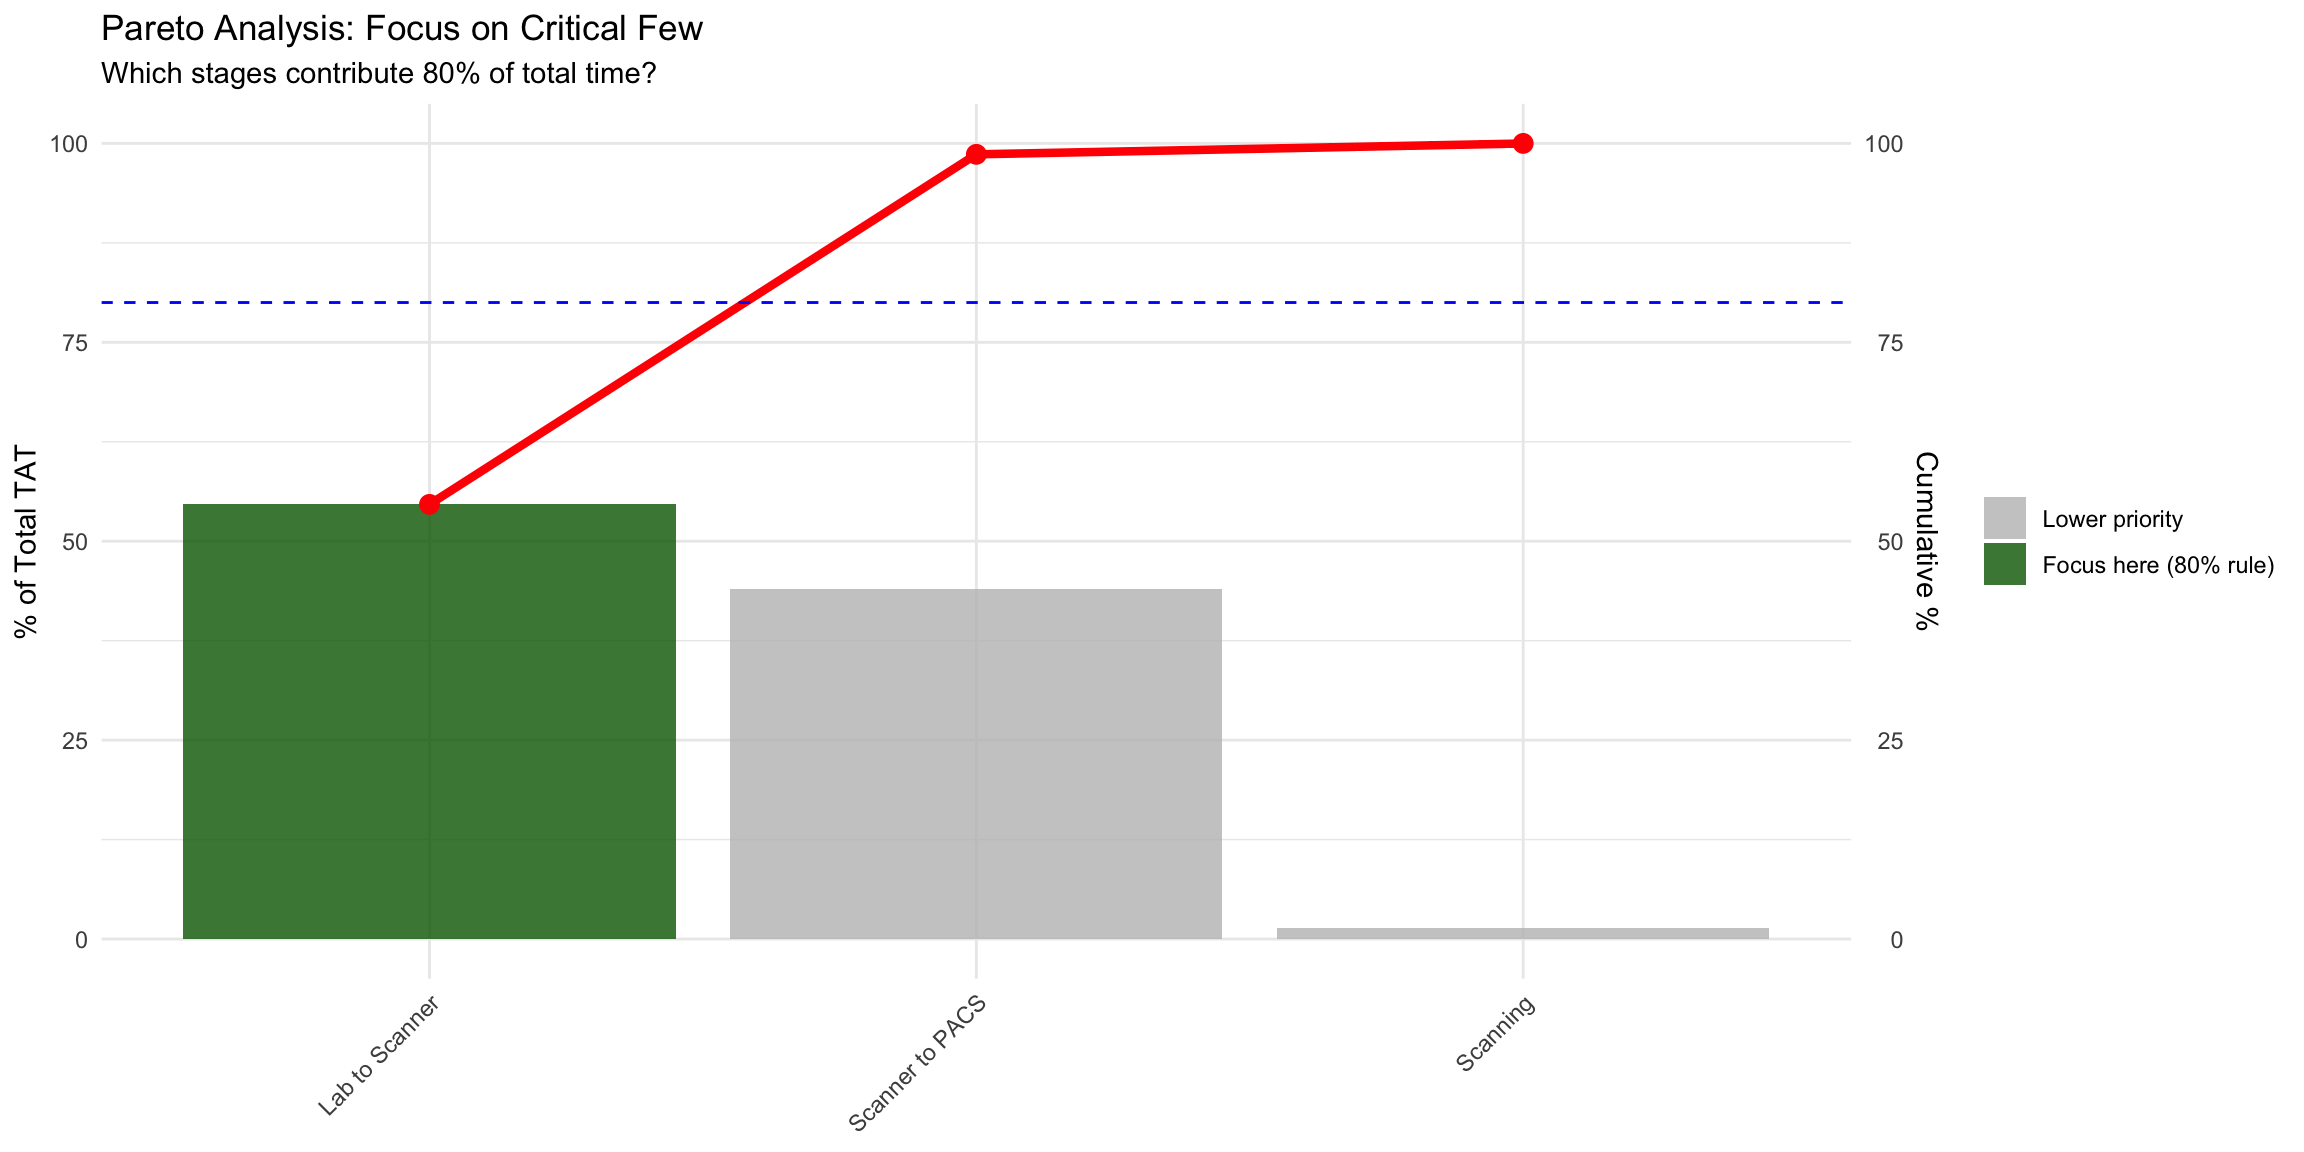
Pareto Principle: - Focus on the “critical few” stages that contribute 80% of total time - Improving these stages yields maximum impact - Lower-priority stages have diminishing returns
13.9 System Throughput Rates
| Stage | Rate |
|---|---|
| Lab Output | 0.01 cases/hour |
| Scan Completion | 0.01 cases/hour |
| PACS Upload | 0.01 cases/hour |
Constraint Identification: - The stage with the lowest throughput rate is the system constraint - System capacity cannot exceed the constraint’s capacity - Adding capacity elsewhere won’t improve overall throughput
13.10 Recommendations by Bottleneck Type
13.10.1 If “Lab to Scanner” is the Primary Bottleneck:
Root Causes: - Slides waiting in queue before loading - Inefficient batch composition - Misalignment between lab completion time and scanner availability - Manual loading delays
Solutions: 1. Real-Time Prioritization: Load urgent cases immediately 2. Shift Alignment: Align scanner loading schedule with lab output peaks 3. Queue Management: Implement FIFO or priority-based loading 4. Automation: Consider automated slide loaders 5. Staffing: Add scanner operators during peak hours
13.10.2 If “Scanning” is the Primary Bottleneck:
Root Causes: - Insufficient scanner capacity - Slow scan speeds (tissue characteristics, settings) - High rescan rates reducing effective capacity - Inefficient batch sizes
Solutions: 1. Capacity Expansion: Add additional scanners (calculate ROI) 2. Scan Optimization: Review scan settings (resolution, compression) 3. Quality Improvement: Reduce rescans (see Rescan Analysis) 4. Batch Optimization: Identify optimal batch sizes 5. Preventive Maintenance: Minimize downtime
13.10.3 If “Scanner to PACS” is the Primary Bottleneck:
Root Causes: - Network bandwidth constraints - PACS server performance issues - Large file sizes (uncompressed images) - Transfer protocol inefficiencies
Solutions: 1. Network Upgrade: Increase bandwidth or dedicated network 2. Compression: Enable image compression (if diagnostically acceptable) 3. Edge Processing: Process images at scanner before transfer 4. PACS Optimization: Work with PACS vendor on performance 5. Parallel Uploads: Enable simultaneous file transfers
13.11 Improvement Impact Analysis
Estimate the impact of reducing bottleneck time:
| Scenario | Current TAT | Time Saved | New TAT | TAT Improvement |
|---|---|---|---|---|
| 20% Reduction in Lab to Scanner | 14.2 hrs | 1.5 hrs | 12.7 hrs | 10.6% |
| 30% Reduction in Lab to Scanner | 14.2 hrs | 2.3 hrs | 12.0 hrs | 15.9% |
| 50% Reduction in Lab to Scanner | 14.2 hrs | 3.8 hrs | 10.5 hrs | 26.5% |
Use this table to: - Estimate ROI of process improvements - Set improvement targets - Justify capital investments
13.12 Action Plan
13.12.1 Immediate Actions (This Month)
- Validate Findings: Confirm bottleneck identification with operational staff
- Measure Baseline: Establish current performance metrics
- Quick Wins: Implement no-cost improvements (schedule alignment, batching)
13.12.2 Short-Term (1-3 Months)
- Process Optimization: Address identified bottleneck with process changes
- Staff Training: Ensure consistency in bottleneck stage operations
- Monitoring: Track daily metrics to measure improvement
13.12.3 Long-Term (3-12 Months)
- Capital Investment: If needed, plan equipment or infrastructure upgrades
- Continuous Improvement: Monitor for new bottlenecks as improvements are made
- Capacity Planning: Use insights for growth planning
13.13 Monitoring Framework
Establish ongoing monitoring:
# Daily dashboard showing:
- Current bottleneck stage distribution
- Average time per stage (vs baseline)
- Cases exceeding TAT targets
- Stage-specific alerts (unusual delays)
Review Frequency: - Daily: Operational dashboard for immediate issues - Weekly: Trend analysis and bottleneck shifts - Monthly: Strategic review and improvement planning
13.14 Conclusion
Bottleneck analysis provides clear direction for improvement efforts. By focusing on the constraint: - Maximize Impact: Every hour saved at the bottleneck reduces overall TAT - Avoid Waste: Don’t optimize non-constraints (they won’t improve throughput) - Systematic Approach: Address bottlenecks sequentially as they shift
Remember: After fixing one bottleneck, another stage becomes the new constraint. Continuous monitoring and iterative improvement are essential.
Current Focus:
**Primary Focus Area: Lab to Scanner**This stage is the bottleneck for 55.6% of cases.Addressing this constraint will have the greatest impact on overall system performance.