| Metric | Value |
|---|---|
| Daily Mean Volume | 89.6 cases |
| Daily Median Volume | 103.0 cases |
| Daily Standard Deviation | 51.8 cases |
| Weekly Mean Volume | 519.1 cases |
| Monthly Mean Volume | 2274.2 cases |
| Peak Day Volume | 198 cases |
| Peak Day Date | 2024-12-06 |
| Lowest Day Volume | 1 cases |
| Lowest Day Date | 2024-04-23 |
12 Temporal Pattern and Forecasting Analysis
12.1 Introduction
Understanding temporal patterns is crucial for: - Capacity Planning: Predict future equipment and staffing needs - Resource Allocation: Identify peak periods requiring additional support - Performance Monitoring: Track whether efficiency is improving over time - Strategic Planning: Anticipate growth and plan investments
This analysis examines patterns across multiple time scales: hourly, daily, weekly, monthly, and seasonal.
12.2 Load Data and Run Analysis
12.3 Volume Statistics Summary
12.4 Daily Volume Trend
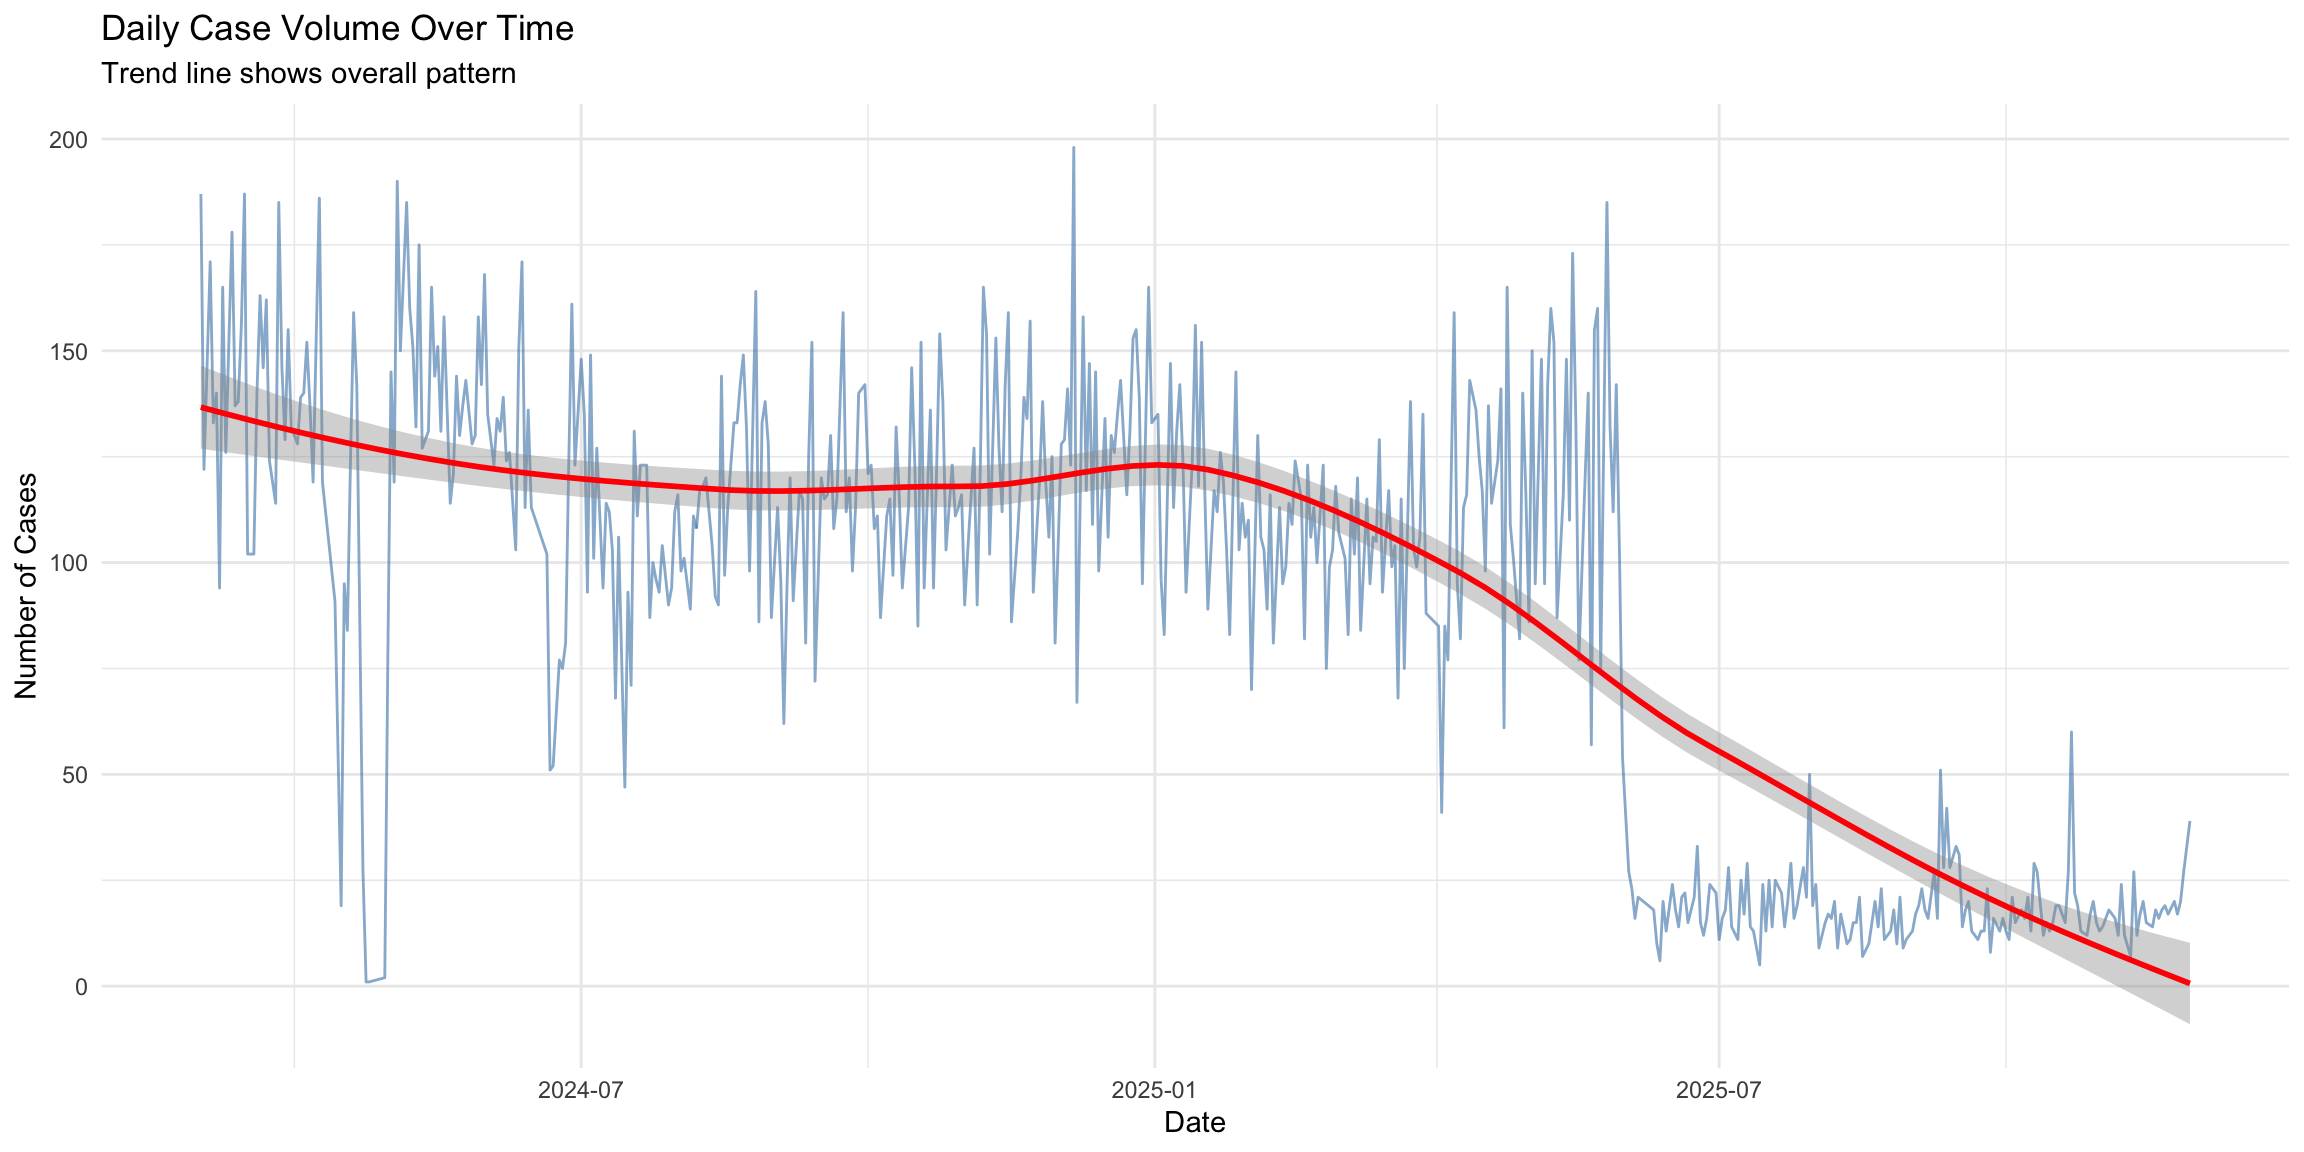
Interpretation: - Overall trajectory (upward, stable, or declining) - Volatility in day-to-day volumes - Significant events or anomalies
12.5 Monthly Volume Trend
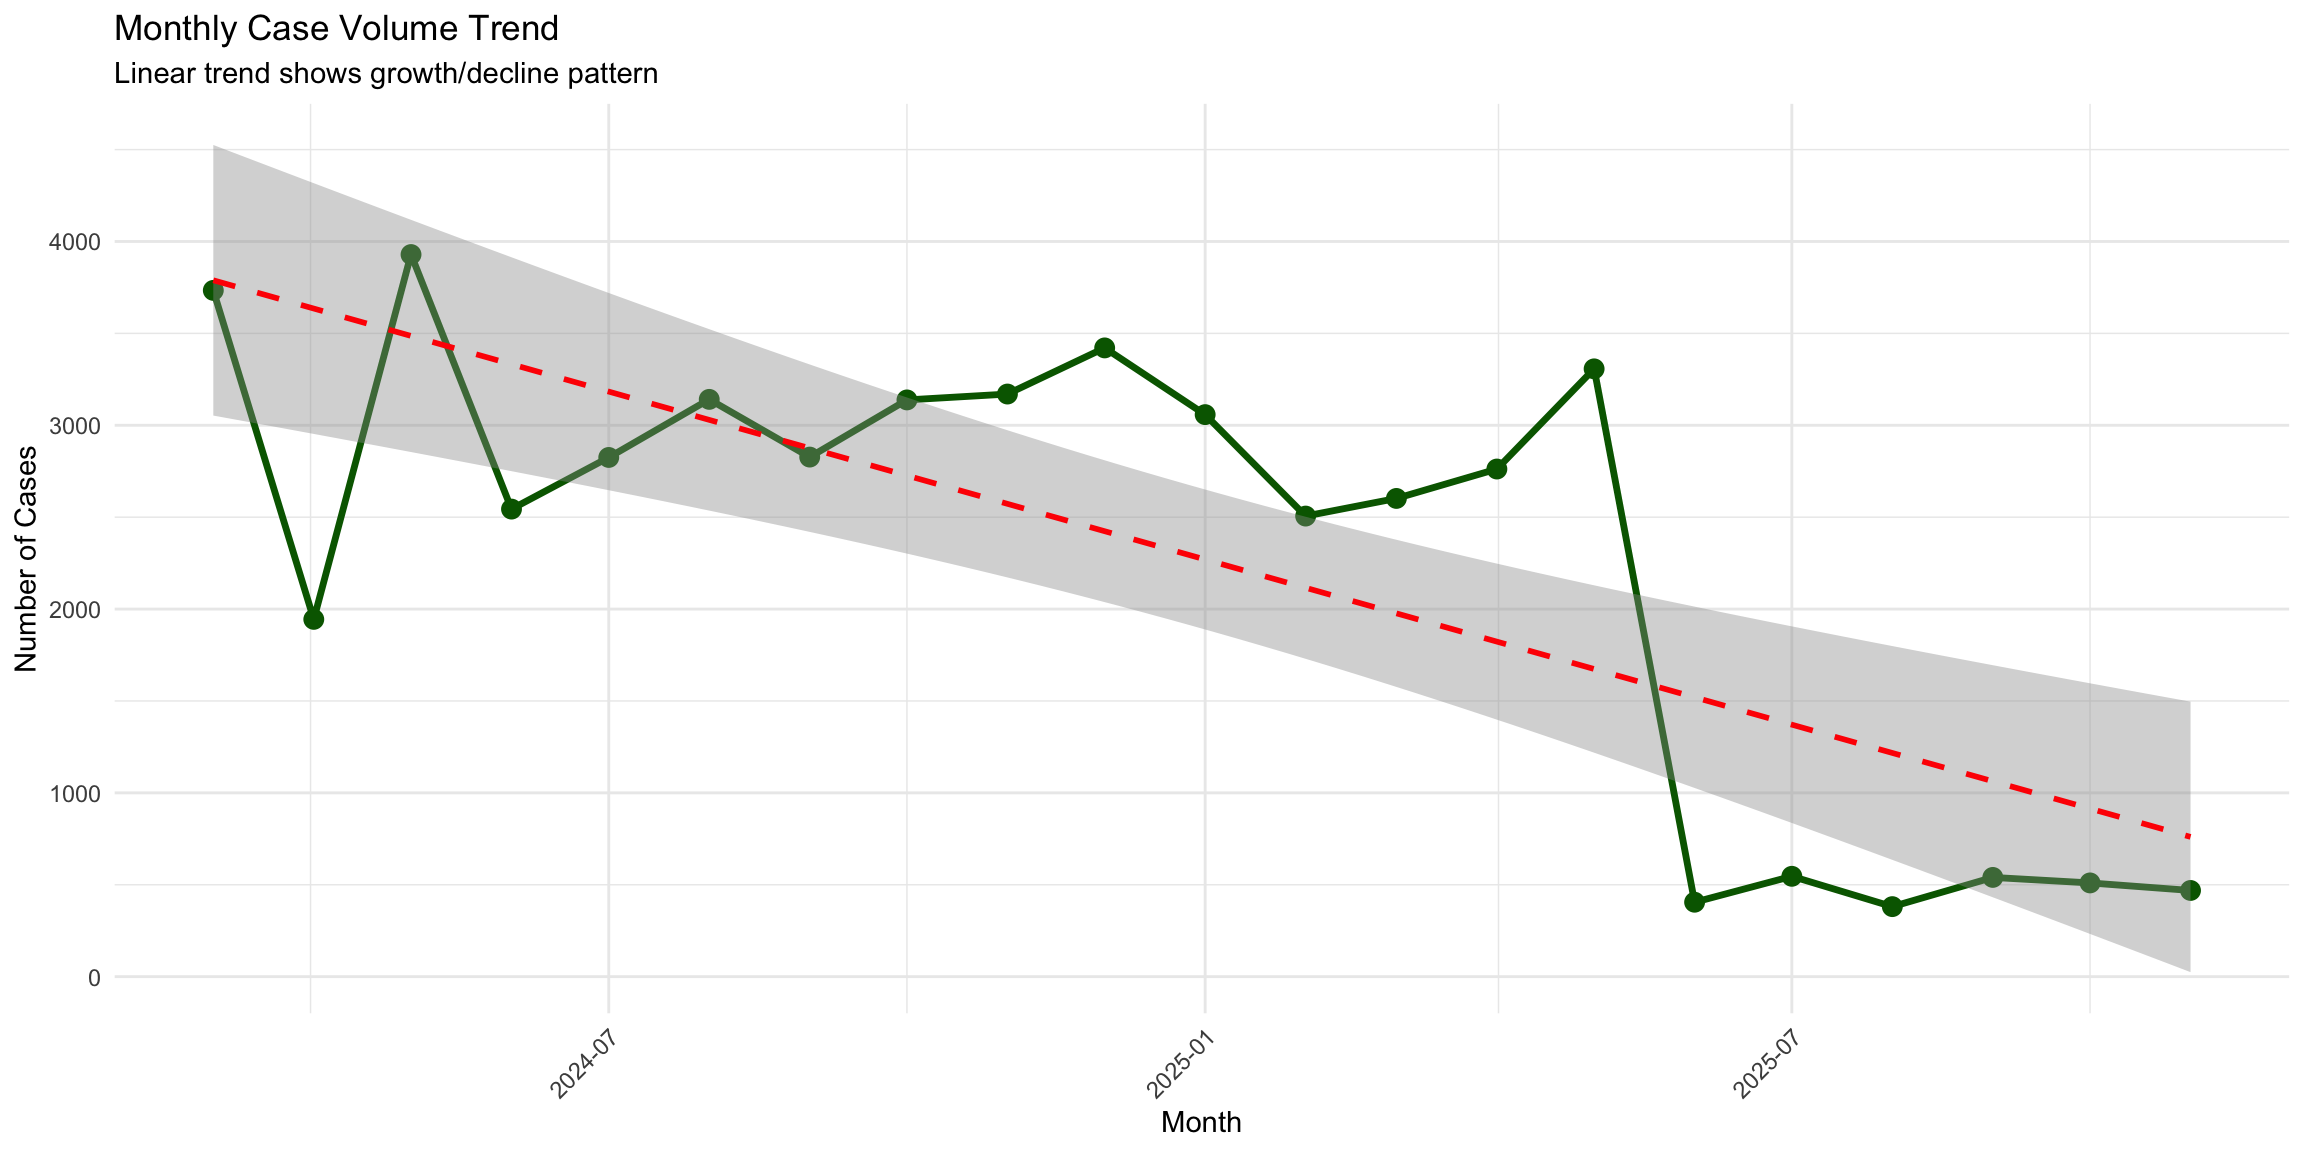
Strategic Questions: - Is volume growing consistently? - Are there inflection points indicating process changes? - When will current capacity be exceeded?
12.6 Year-over-Year Growth
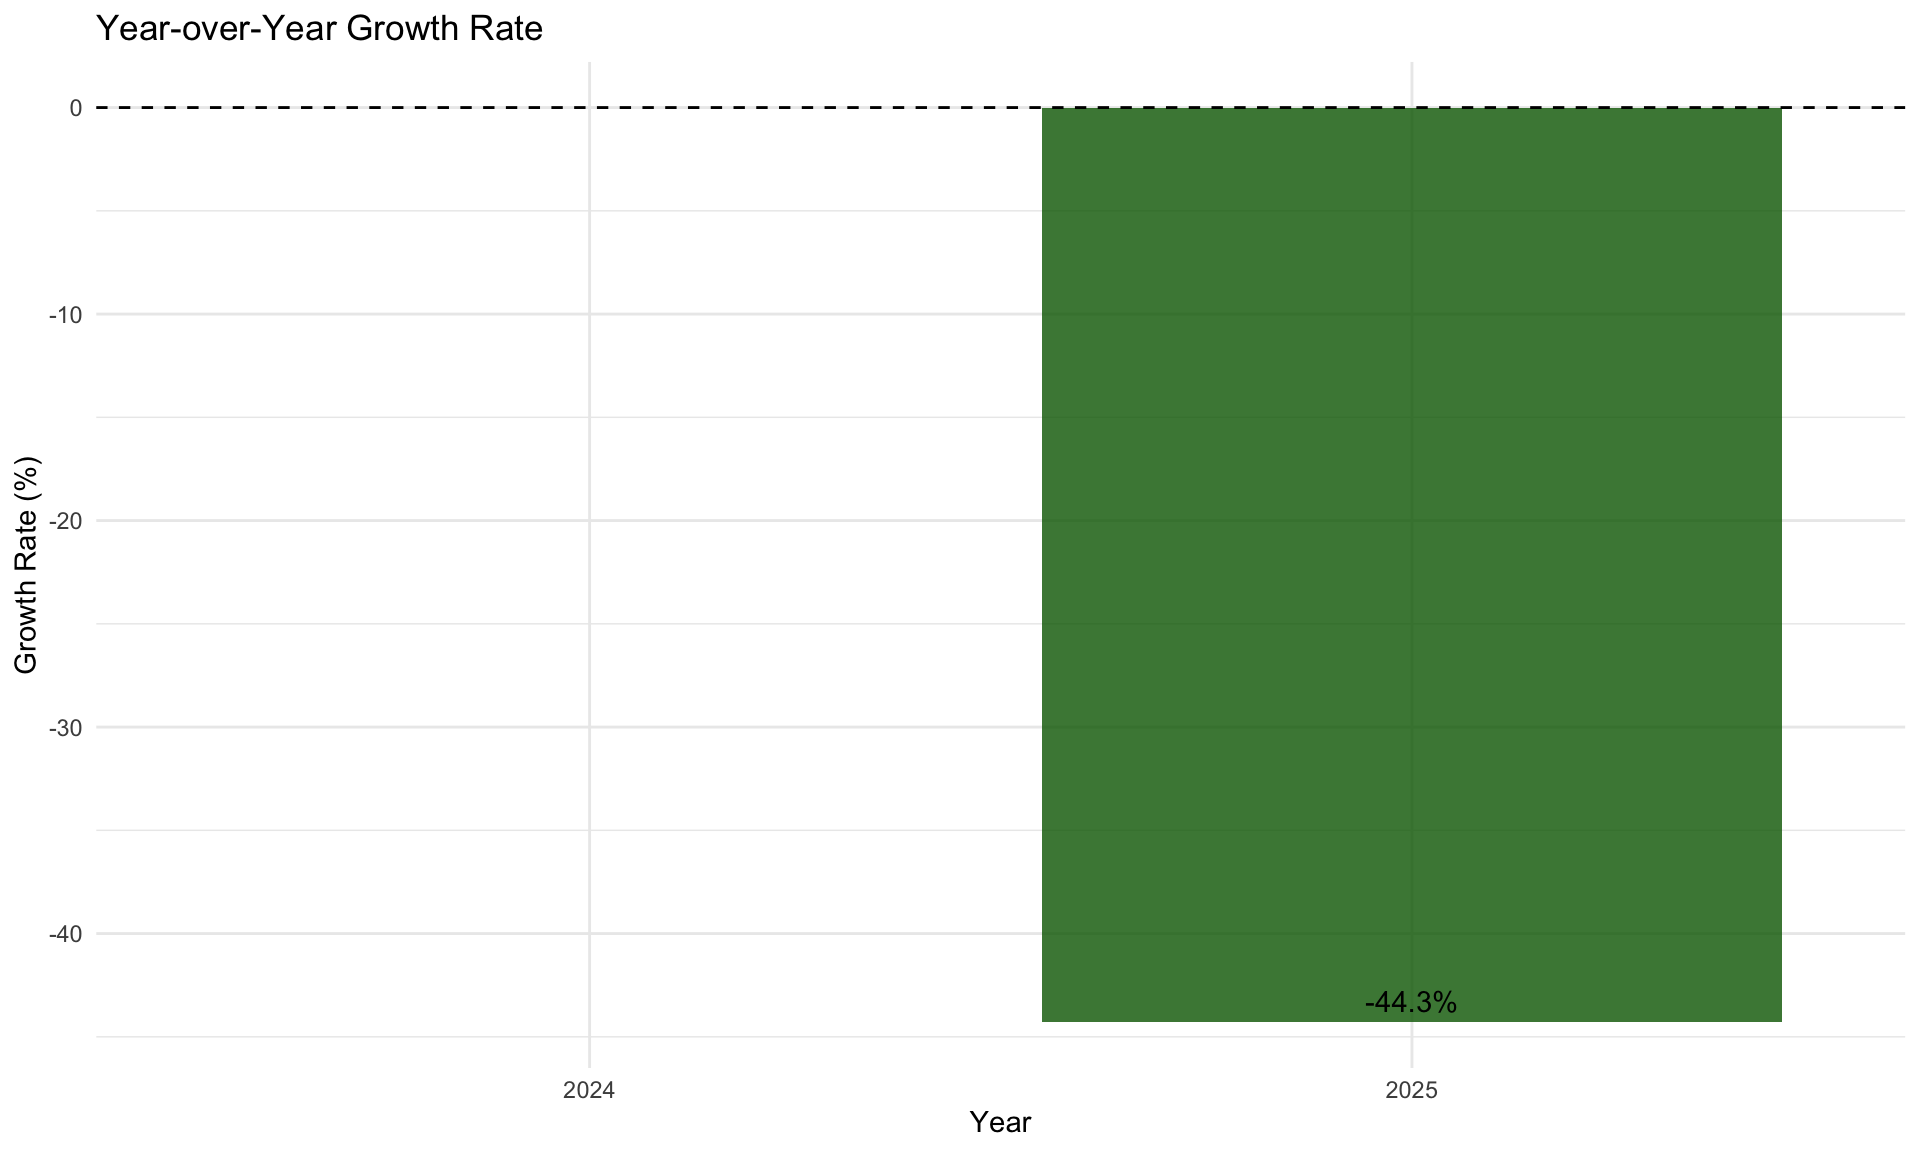
| Year | Total Cases | YoY Growth (%) |
|---|---|---|
| 2024 | 30673 | NA |
| 2025 | 17086 | -44.3 |
12.7 Day of Week Patterns
| Day of Week | Total Cases | Avg Cases/Day | Avg TAT (hrs) | Median TAT (hrs) |
|---|---|---|---|---|
| Mon | 8090 | 91.93 | 11.54 | 6.59 |
| Tue | 7765 | 85.33 | 15.97 | 8.39 |
| Wed | 7657 | 87.01 | 18.20 | 8.44 |
| Thu | 8270 | 92.92 | 19.58 | 8.65 |
| Fri | 8835 | 99.27 | 16.81 | 9.24 |
| Sat | 7142 | 79.36 | 18.73 | 7.18 |
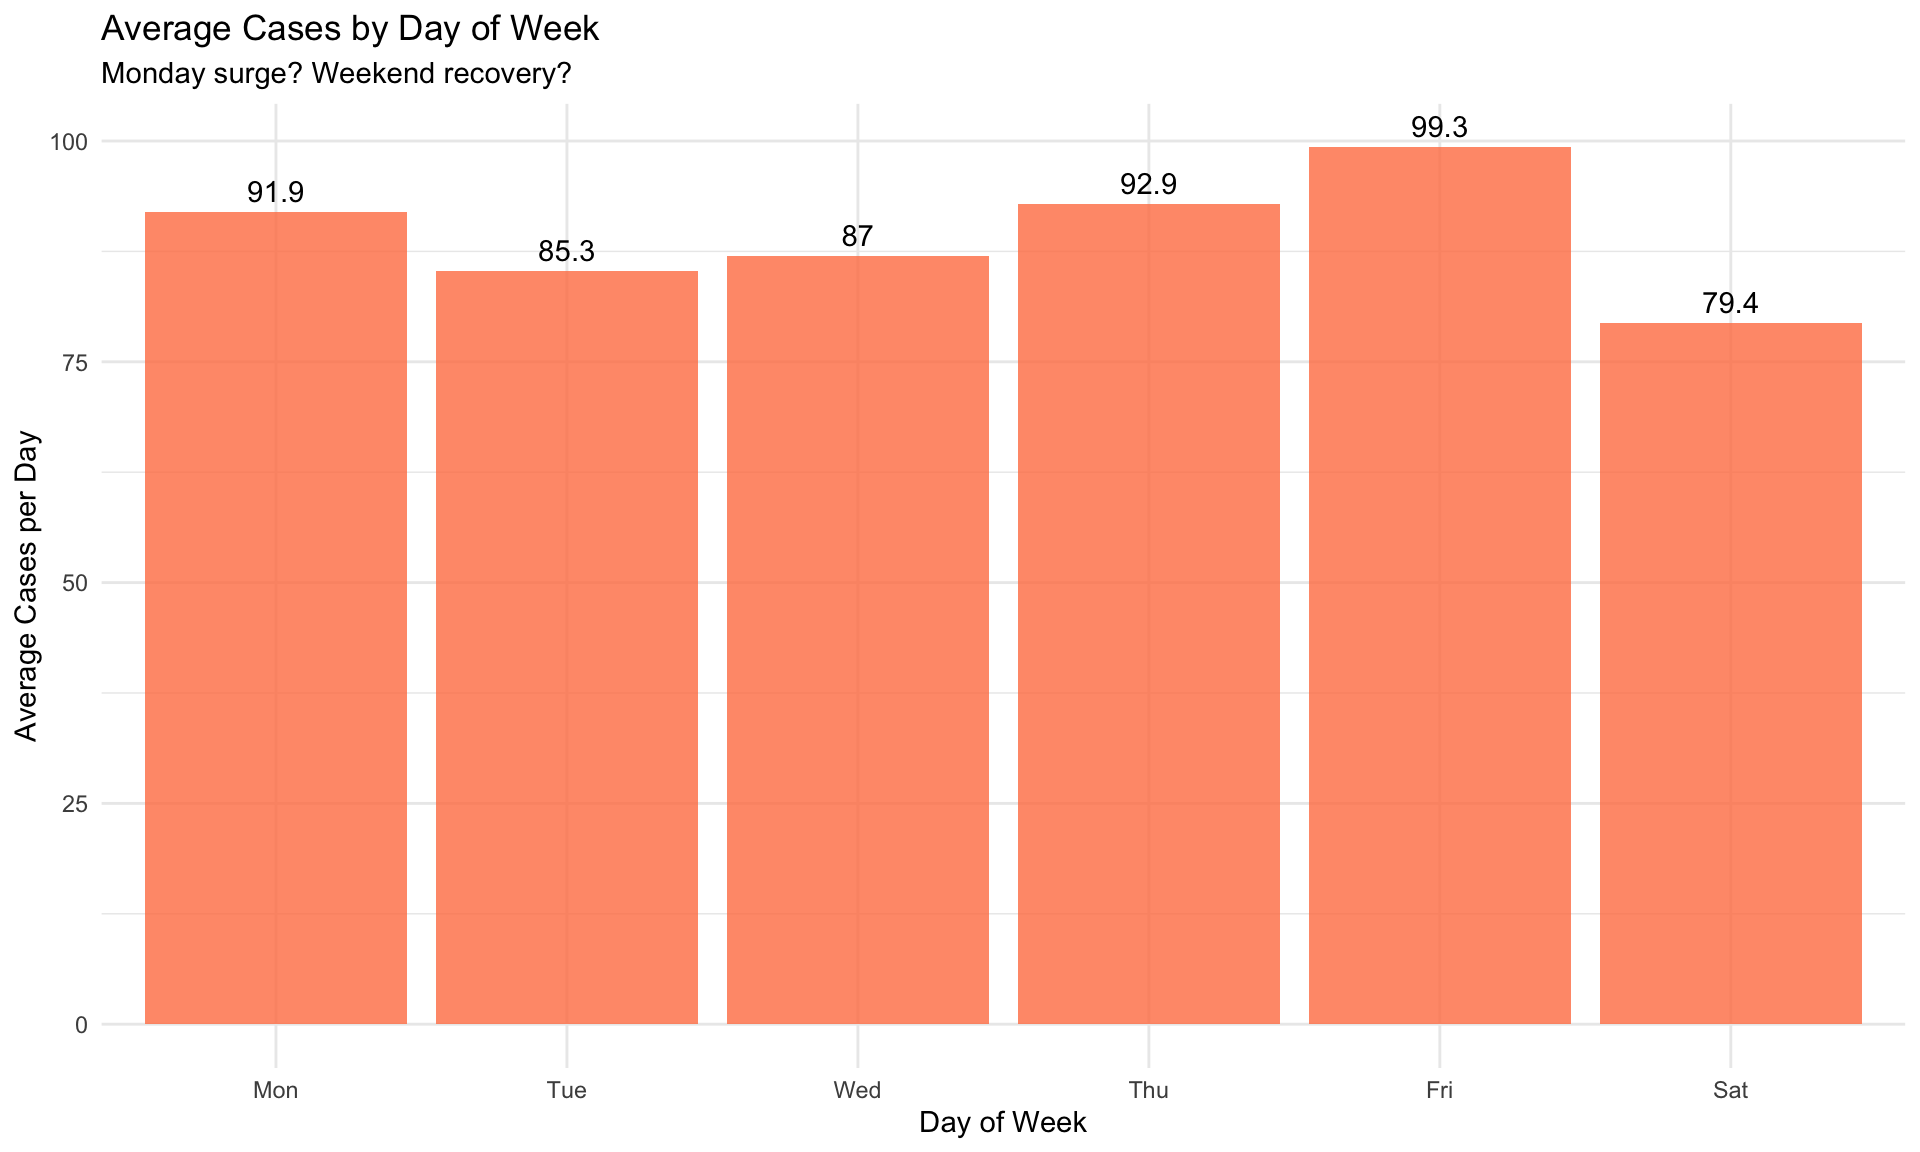
Operational Insights: - Monday Effect: Is there a backlog from the weekend? - Friday Pattern: Does end-of-week volume drop? - Midweek Peaks: Are staffing levels aligned with demand?
12.8 Hour of Day Patterns
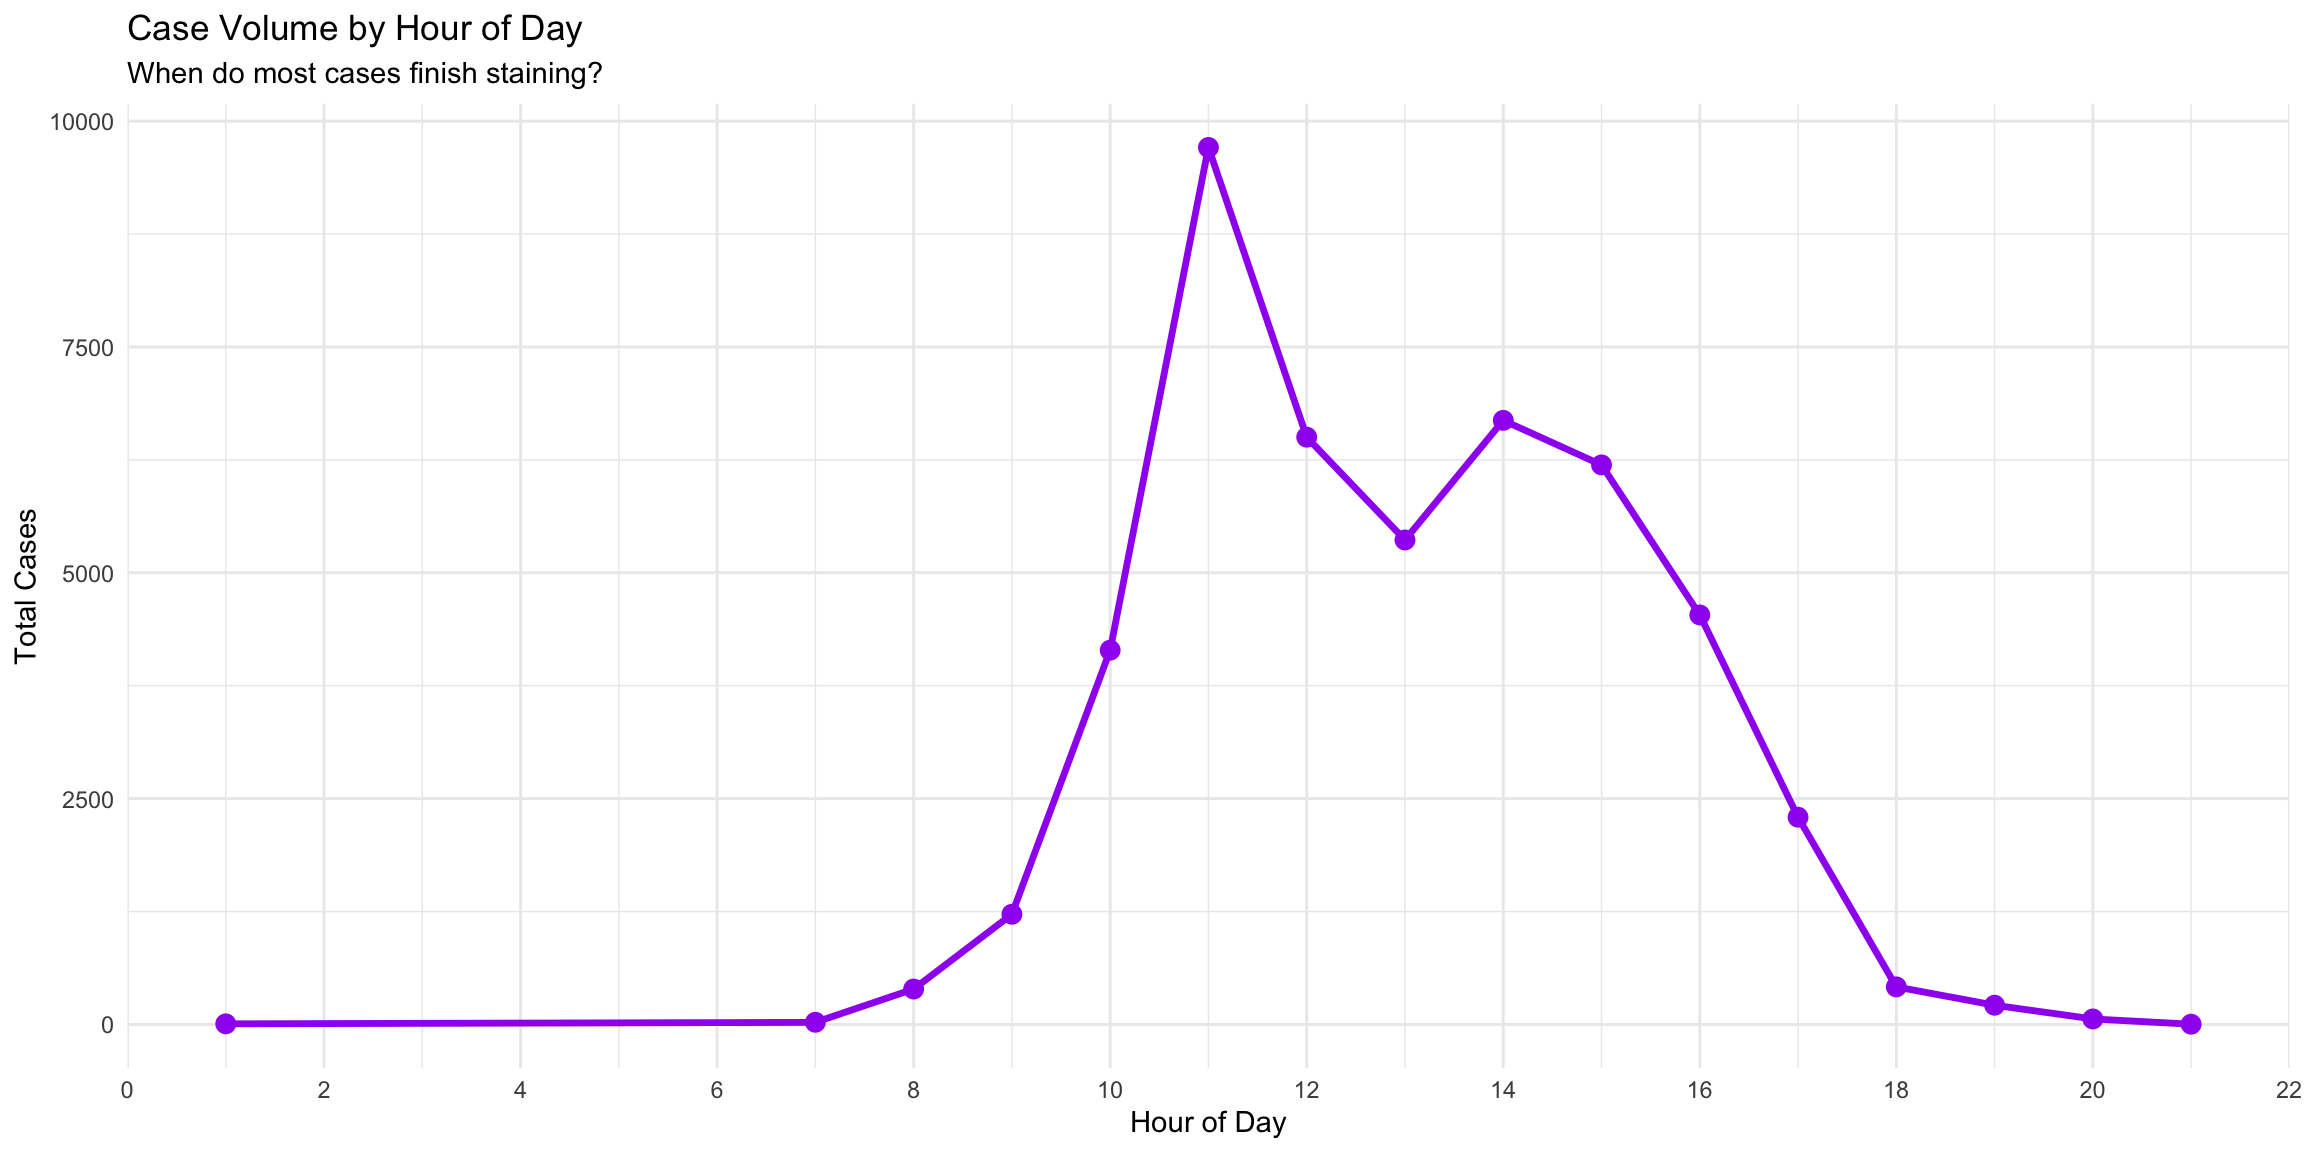
Key Questions: - When do most cases complete staining? - Are scanners ready when slides arrive? - Should scanning shifts be adjusted?
12.9 Seasonal Patterns
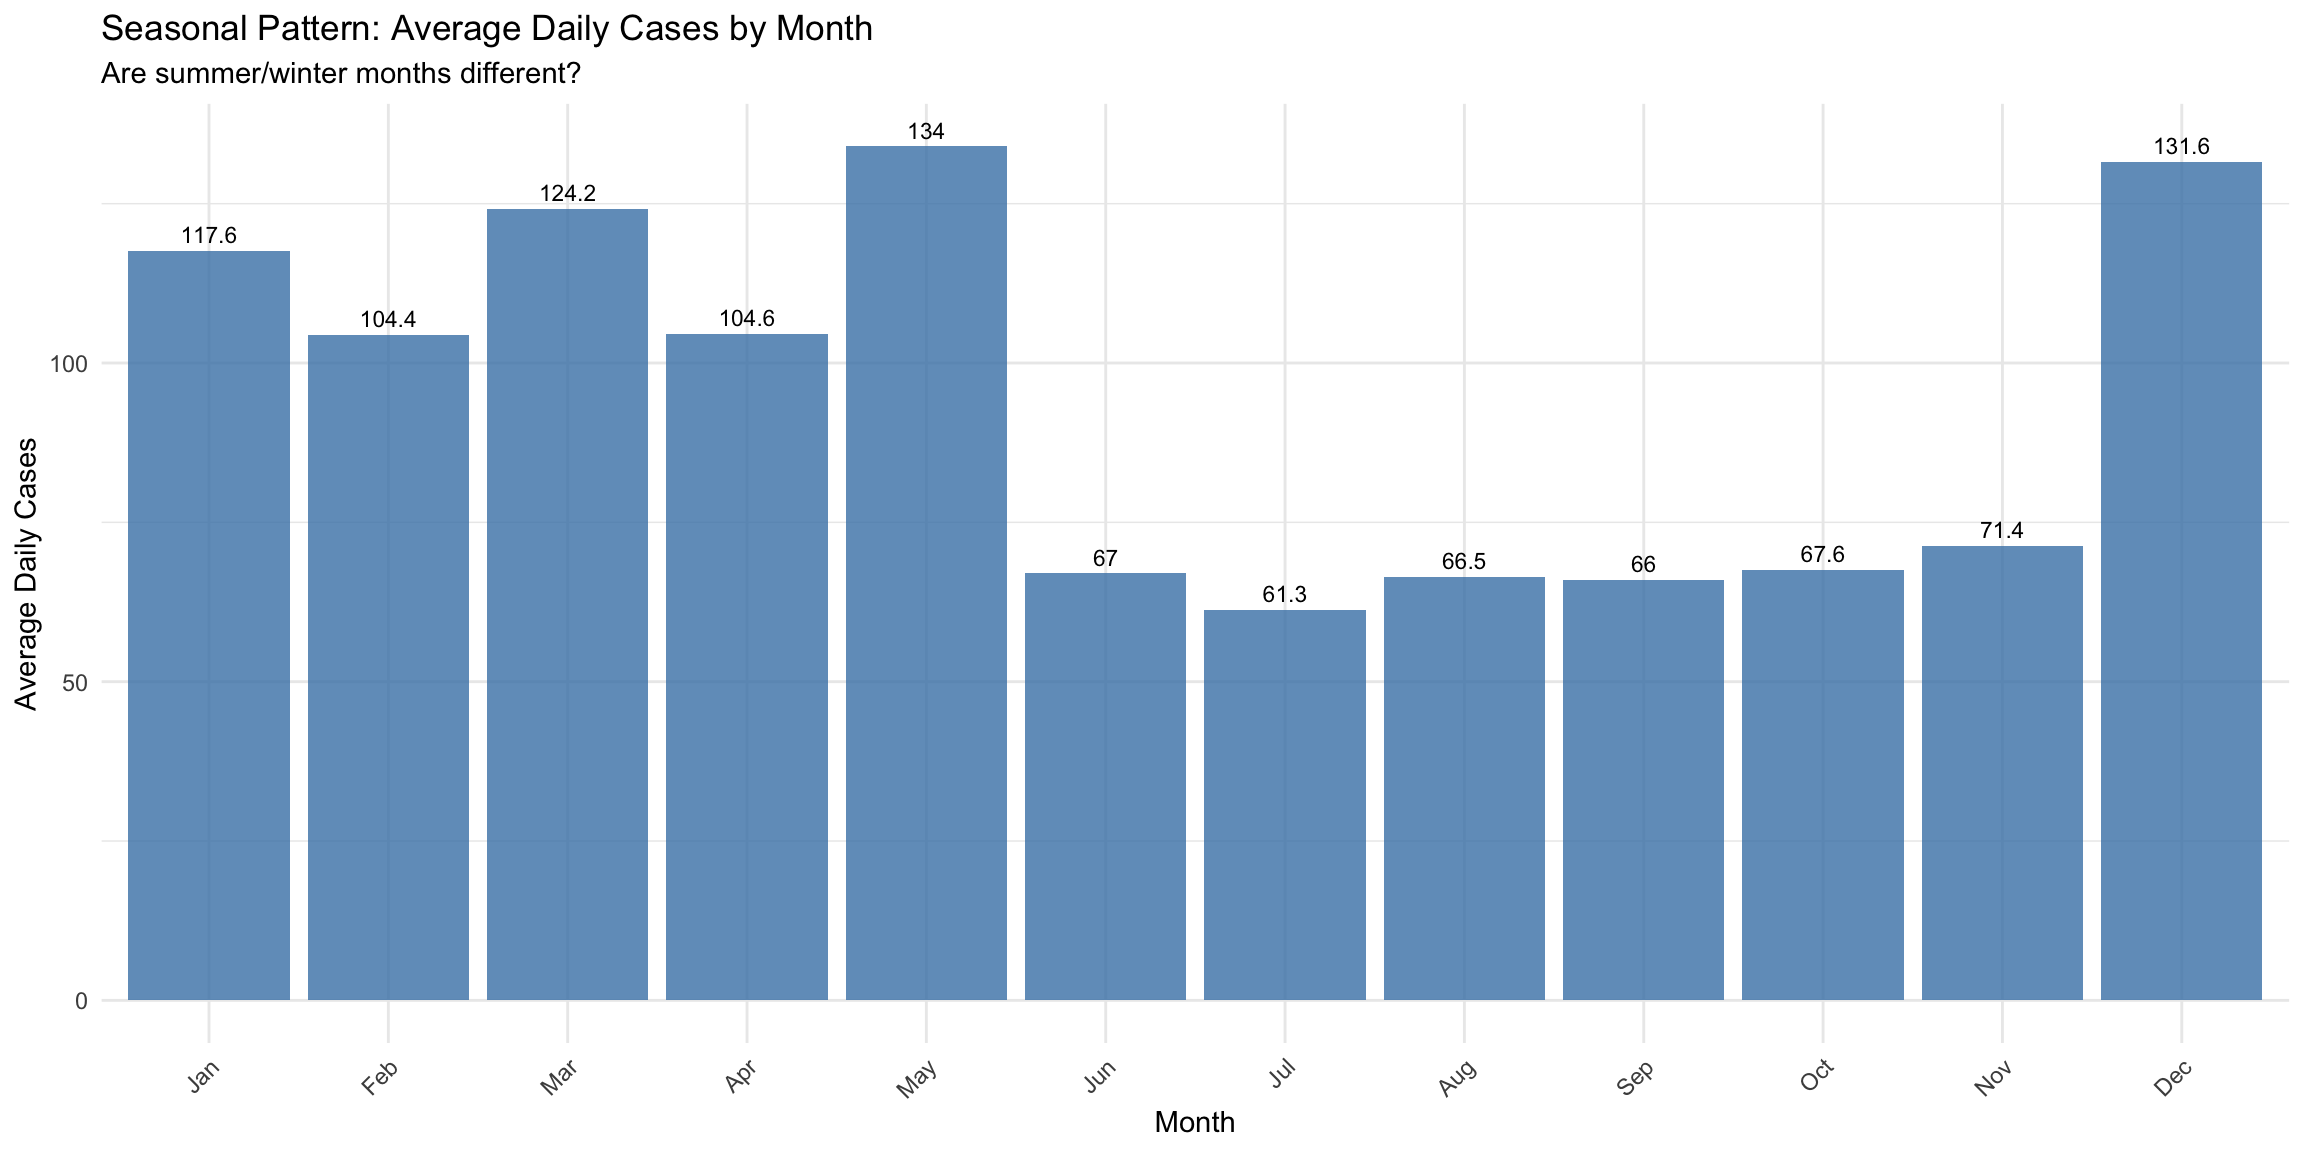
Seasonal Considerations: - Summer: Vacation coverage, reduced surgical volume? - Winter: Holiday effects, flu season impact? - Academic Calendar: Teaching hospital patterns?
12.10 Volume Heatmap
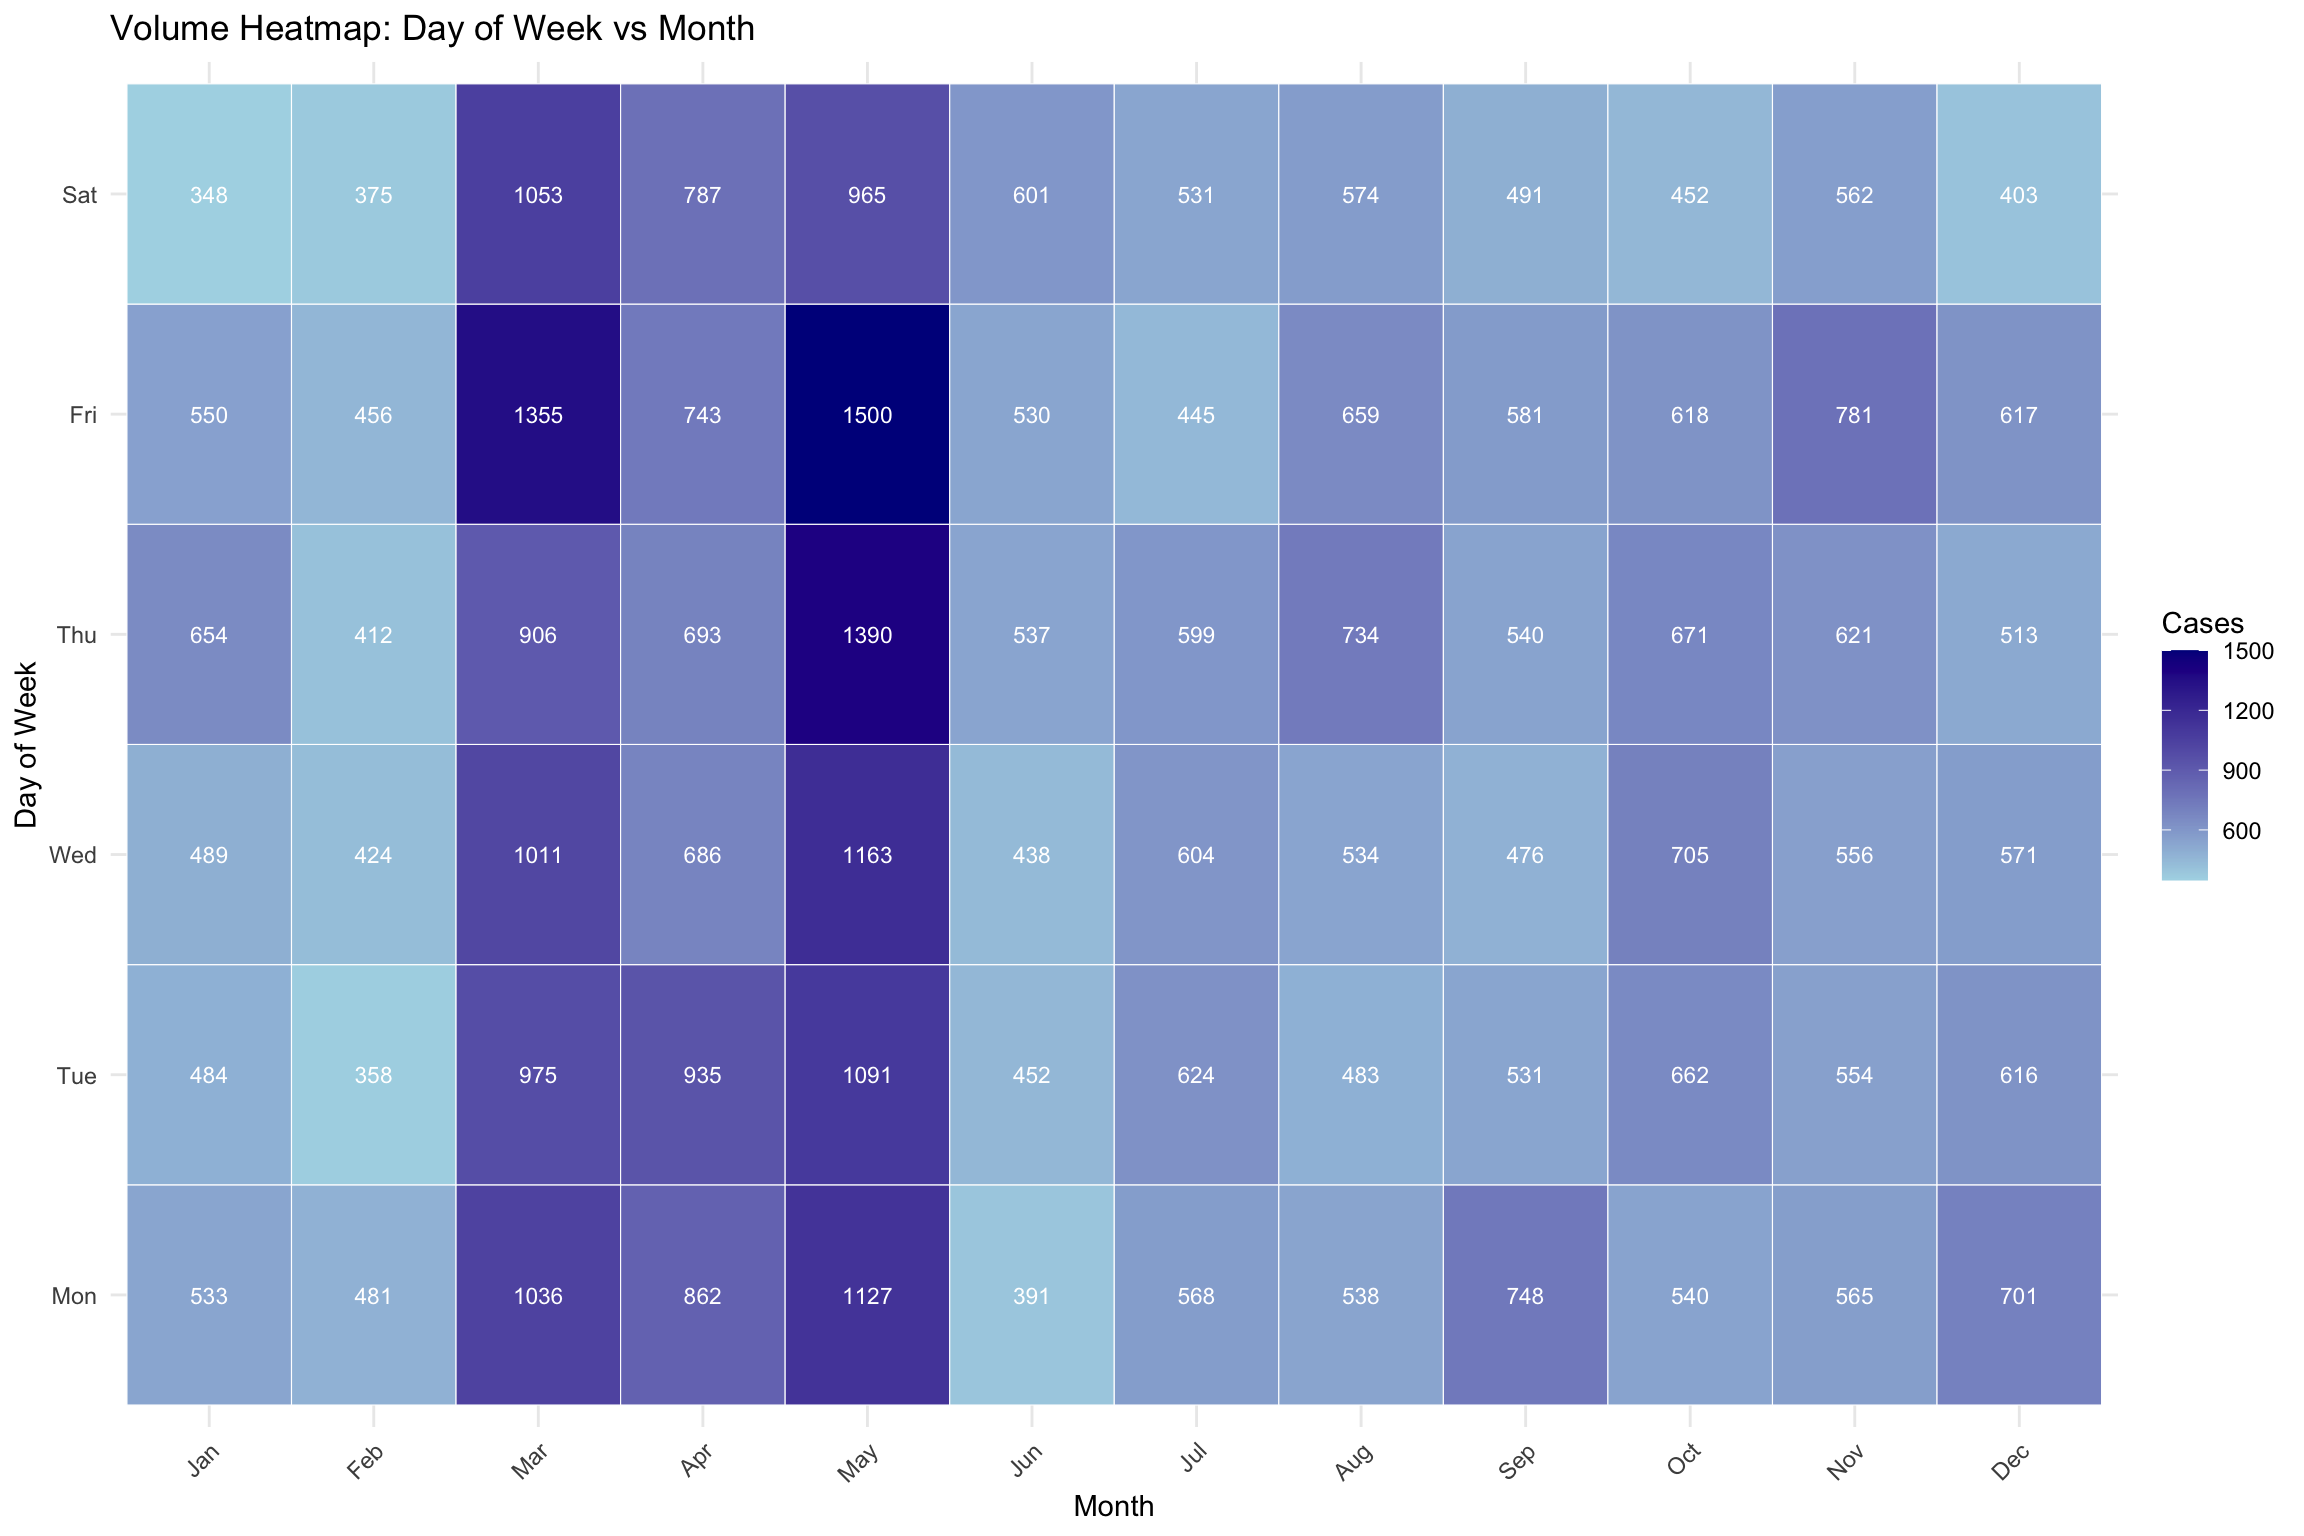
Advanced Pattern Recognition: - Identifies specific day-month combinations with unusual volume - Useful for planning maintenance windows - Highlights consistent patterns vs anomalies
12.11 Turnaround Time Trend
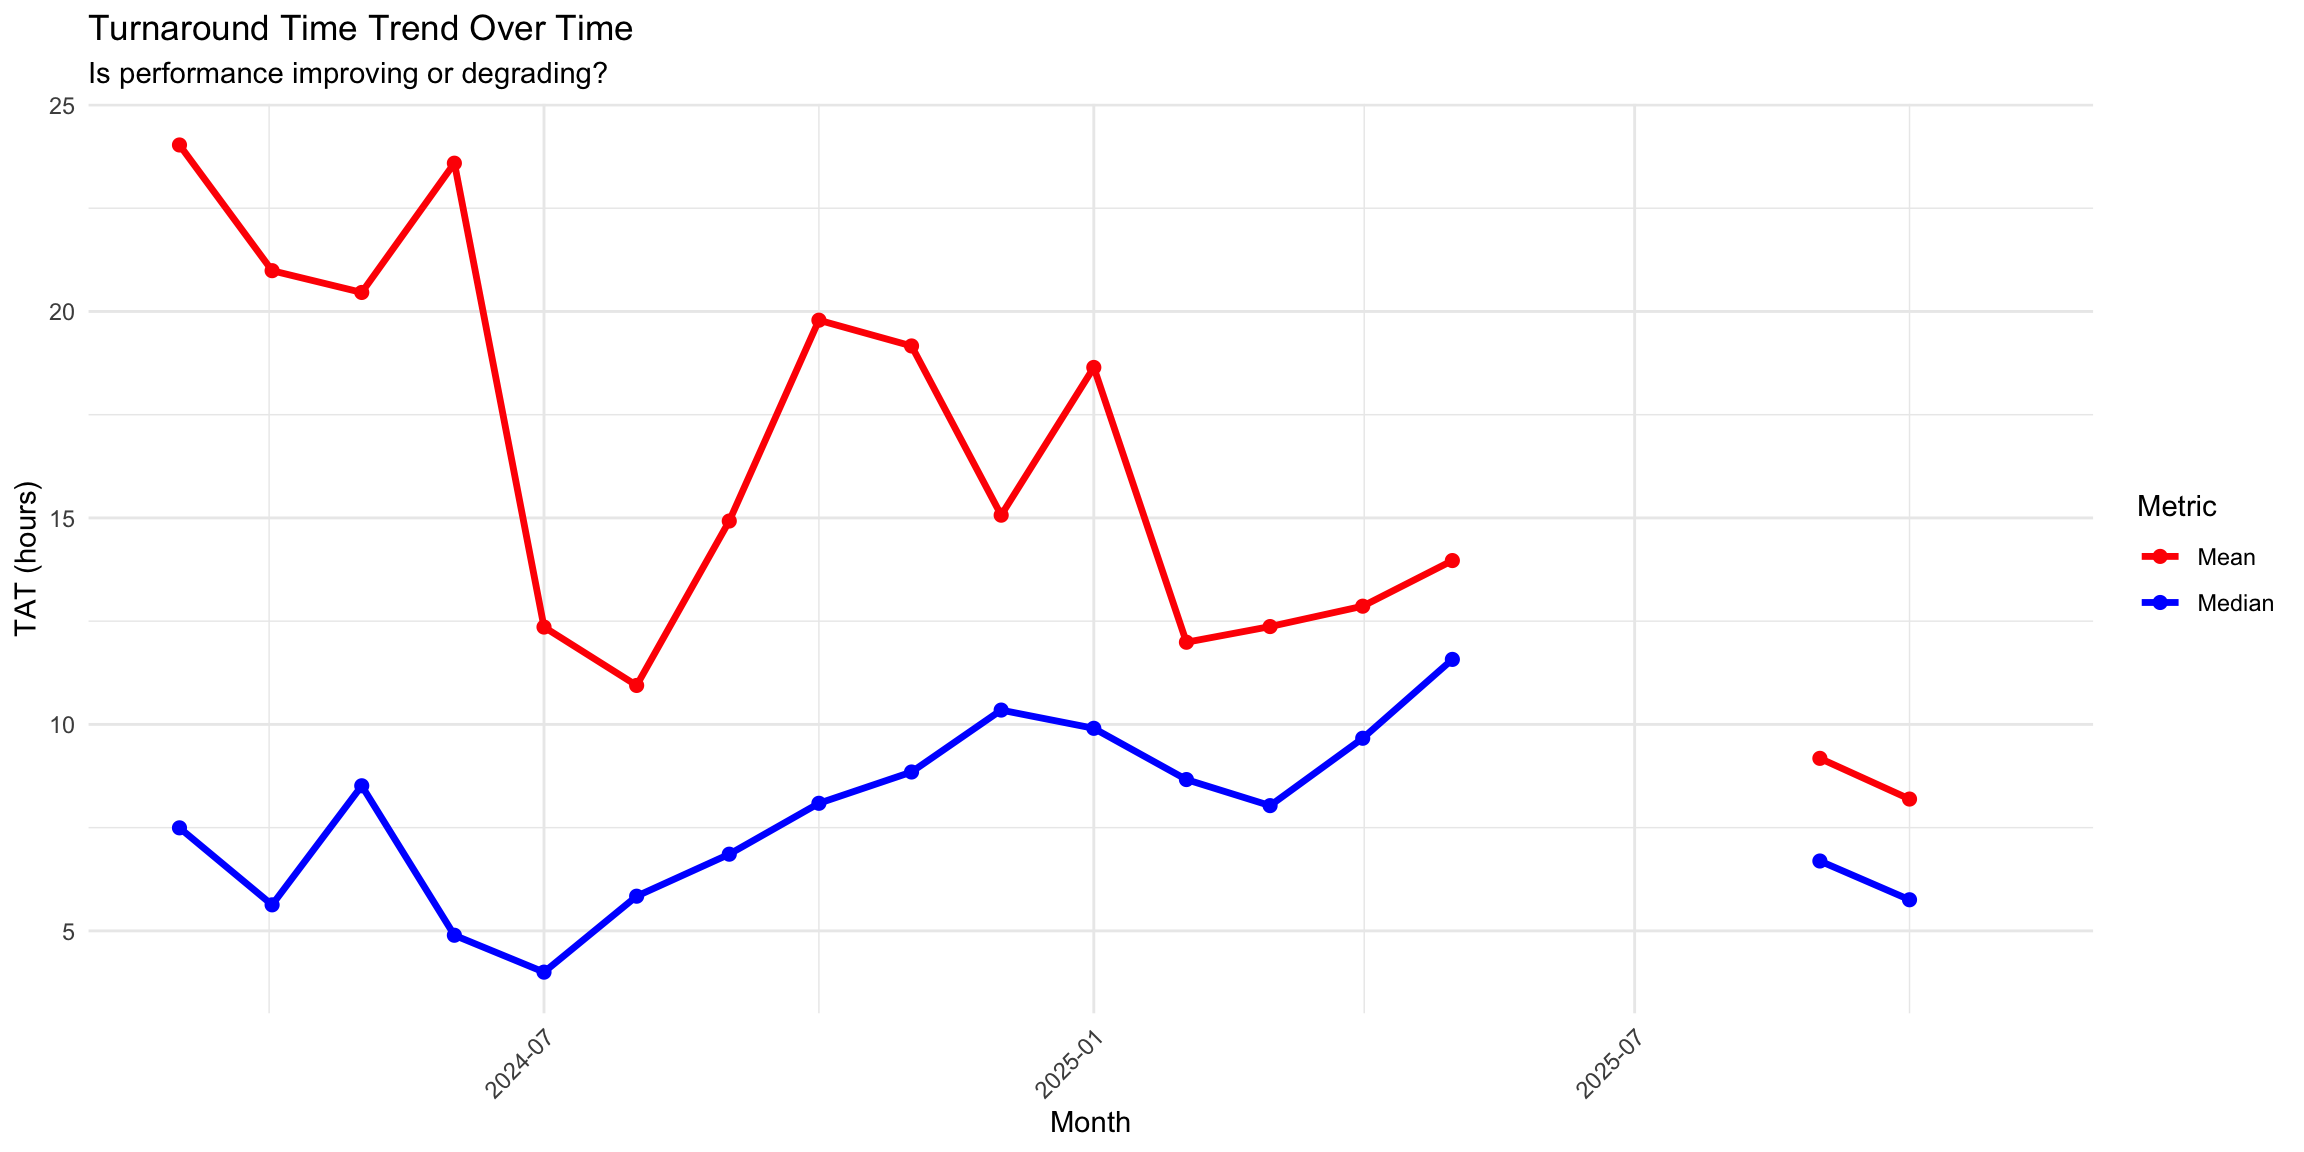
Performance Questions: - Is TAT improving with experience? - Are recent changes helping or hurting? - Is variability decreasing (more predictable)?
12.12 Simple Forecasting
**Linear Model Summary:**Monthly growth rate: -0.00 cases/monthR-squared: 0.571| Month | Predicted Cases | Lower Bound (80%) | Upper Bound (120%) |
|---|---|---|---|
| NA | NA | NA | NA |
| :----- | ---------------: | -----------------: | ------------------: |
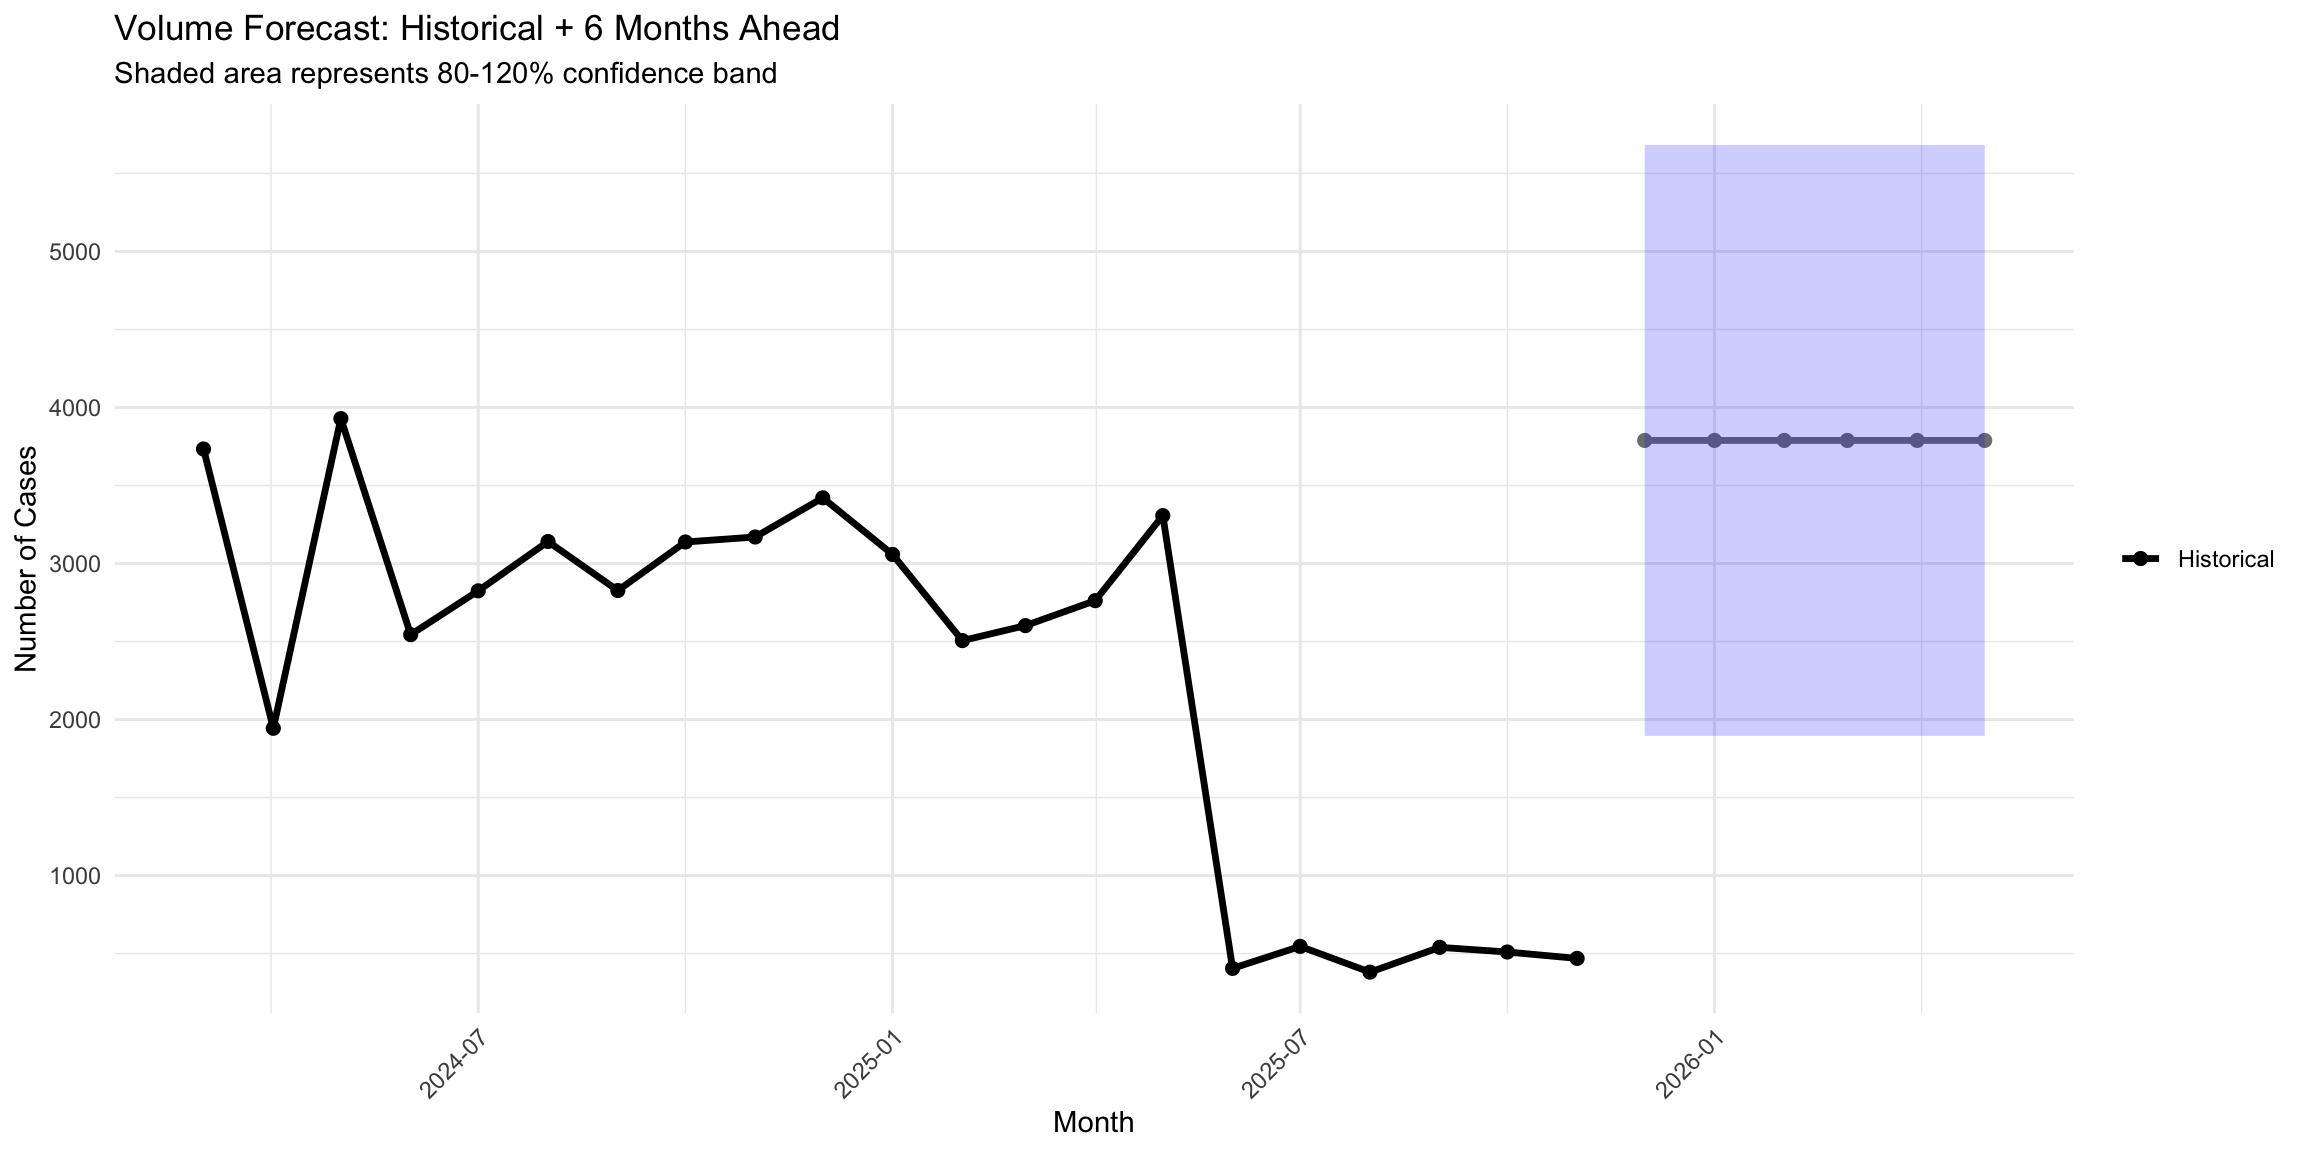
Forecasting Notes: - Simple linear extrapolation (assumes constant growth rate) - Confidence bands represent ±20% variation - Real-world factors (holidays, facility changes) may alter predictions - Update forecast monthly with new data
12.13 Capacity Planning Implications
Based on the forecast and current scanner capacity:
| Metric | Value |
|---|---|
| Current Monthly Cases (Avg) | 2274 |
| Current Monthly Slides (Est) | 14088 |
| Total Monthly Capacity (Slides) | 17600 |
| Current Utilization (%) | 80.0% |
| Months to 100% Capacity | Not applicable (declining or stable) |
| Estimated Capacity Date | N/A |
Recommendations:
- If utilization >80%: Plan for additional scanner capacity within 6 months
- If utilization >90%: Immediate capacity expansion or workflow optimization needed
- If declining: Evaluate operational efficiency and cost per scan
- If stable: Focus on process optimization and quality improvement
12.14 Holiday and Special Event Analysis
| Date | Day | Cases | % of Avg |
|---|---|---|---|
| 2024-04-23 | Tue | 1 | 1.1 |
| 2024-04-24 | Wed | 1 | 1.1 |
| 2024-04-29 | Mon | 2 | 2.2 |
| 2025-06-11 | Wed | 10 | 11.2 |
| 2025-06-12 | Thu | 6 | 6.7 |
| 2025-06-14 | Sat | 13 | 14.5 |
| 2025-06-18 | Wed | 14 | 15.6 |
| 2025-06-26 | Thu | 12 | 13.4 |
| 2025-07-01 | Tue | 11 | 12.3 |
| 2025-07-05 | Sat | 14 | 15.6 |
12.15 Conclusion
Temporal pattern analysis enables: - Proactive Planning: Anticipate peaks and valleys - Resource Optimization: Align staffing with demand - Performance Tracking: Monitor trends and set targets - Strategic Investment: Plan capacity expansion timing
Key Takeaways: 1. Consistent patterns enable predictable operations 2. Anomalies warrant investigation (system issues vs external factors) 3. Growth trends inform equipment purchase timing 4. Seasonal adjustments improve efficiency
Next Steps: - Update forecasts monthly - Correlate volume with external factors (surgical schedules, referral patterns) - Develop automated alerting for unusual patterns - Consider more sophisticated forecasting methods (ARIMA, Prophet)