| Metric | Value |
|---|---|
| Total Unique Slides | 618,304 |
| Slides Requiring Rescan | 70,345 |
| Overall Rescan Rate (%) | 11.38% |
| First-Pass Success Rate (%) | 88.62% |
| Single Rescans | 66,022 |
| Multiple Rescans (≥3 attempts) | 4,323 |
| Average Time to Rescan (hours) | 46.1 |
| Scanner Changed for Rescan (%) | 5.4% |
19 Enhanced Rescan Analysis
19.1 Introduction
Rescan analysis reveals critical quality metrics and hidden costs in the digital pathology workflow. Each rescan represents: - Quality Issues: Focus problems, tissue artifacts, or technical failures - Time Costs: Re-handling, re-loading, and additional scan time - Labor Costs: Technician intervention and quality review - Delay Impact: Extended turnaround time for affected cases
This enhanced analysis investigates rescan patterns across multiple dimensions: scanner performance, temporal trends, and operational factors.
19.2 Load Data and Run Analysis
19.3 Overall Statistics
19.4 Rescan Distribution
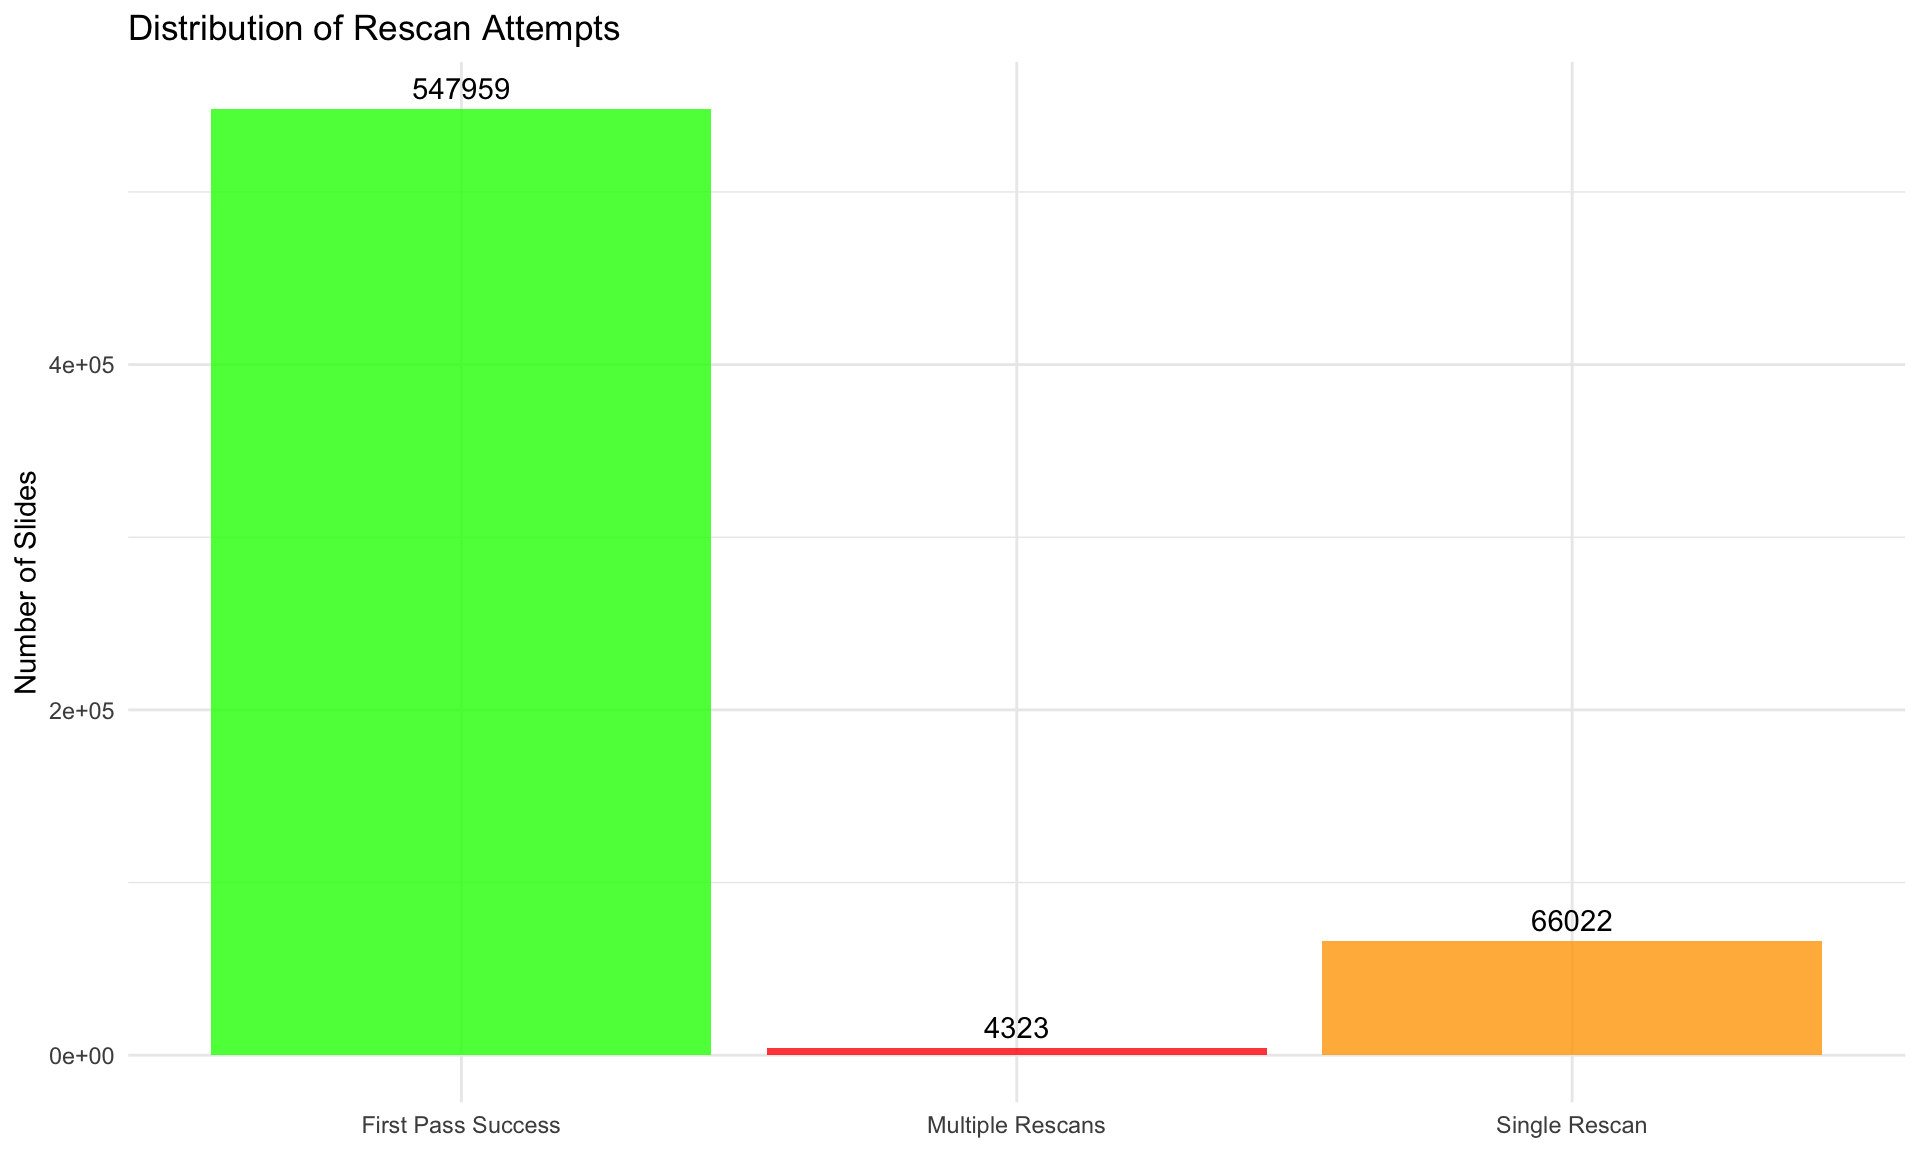
Interpretation: - Green: Successful first-pass scans (target: >95%) - Orange: Required one rescan (acceptable with proper QC) - Red: Multiple failures (requires investigation)
19.5 Performance by Slide Category
| Category | Total Slides | Rescanned | Rescan Rate (%) | First Pass Success | Avg Time to Rescan (hrs) |
|---|---|---|---|---|---|
| Ancillary | 278474 | 37861 | 13.60 | 240613 | 56.06 |
| Routine HE | 339830 | 32484 | 9.56 | 307346 | 34.56 |
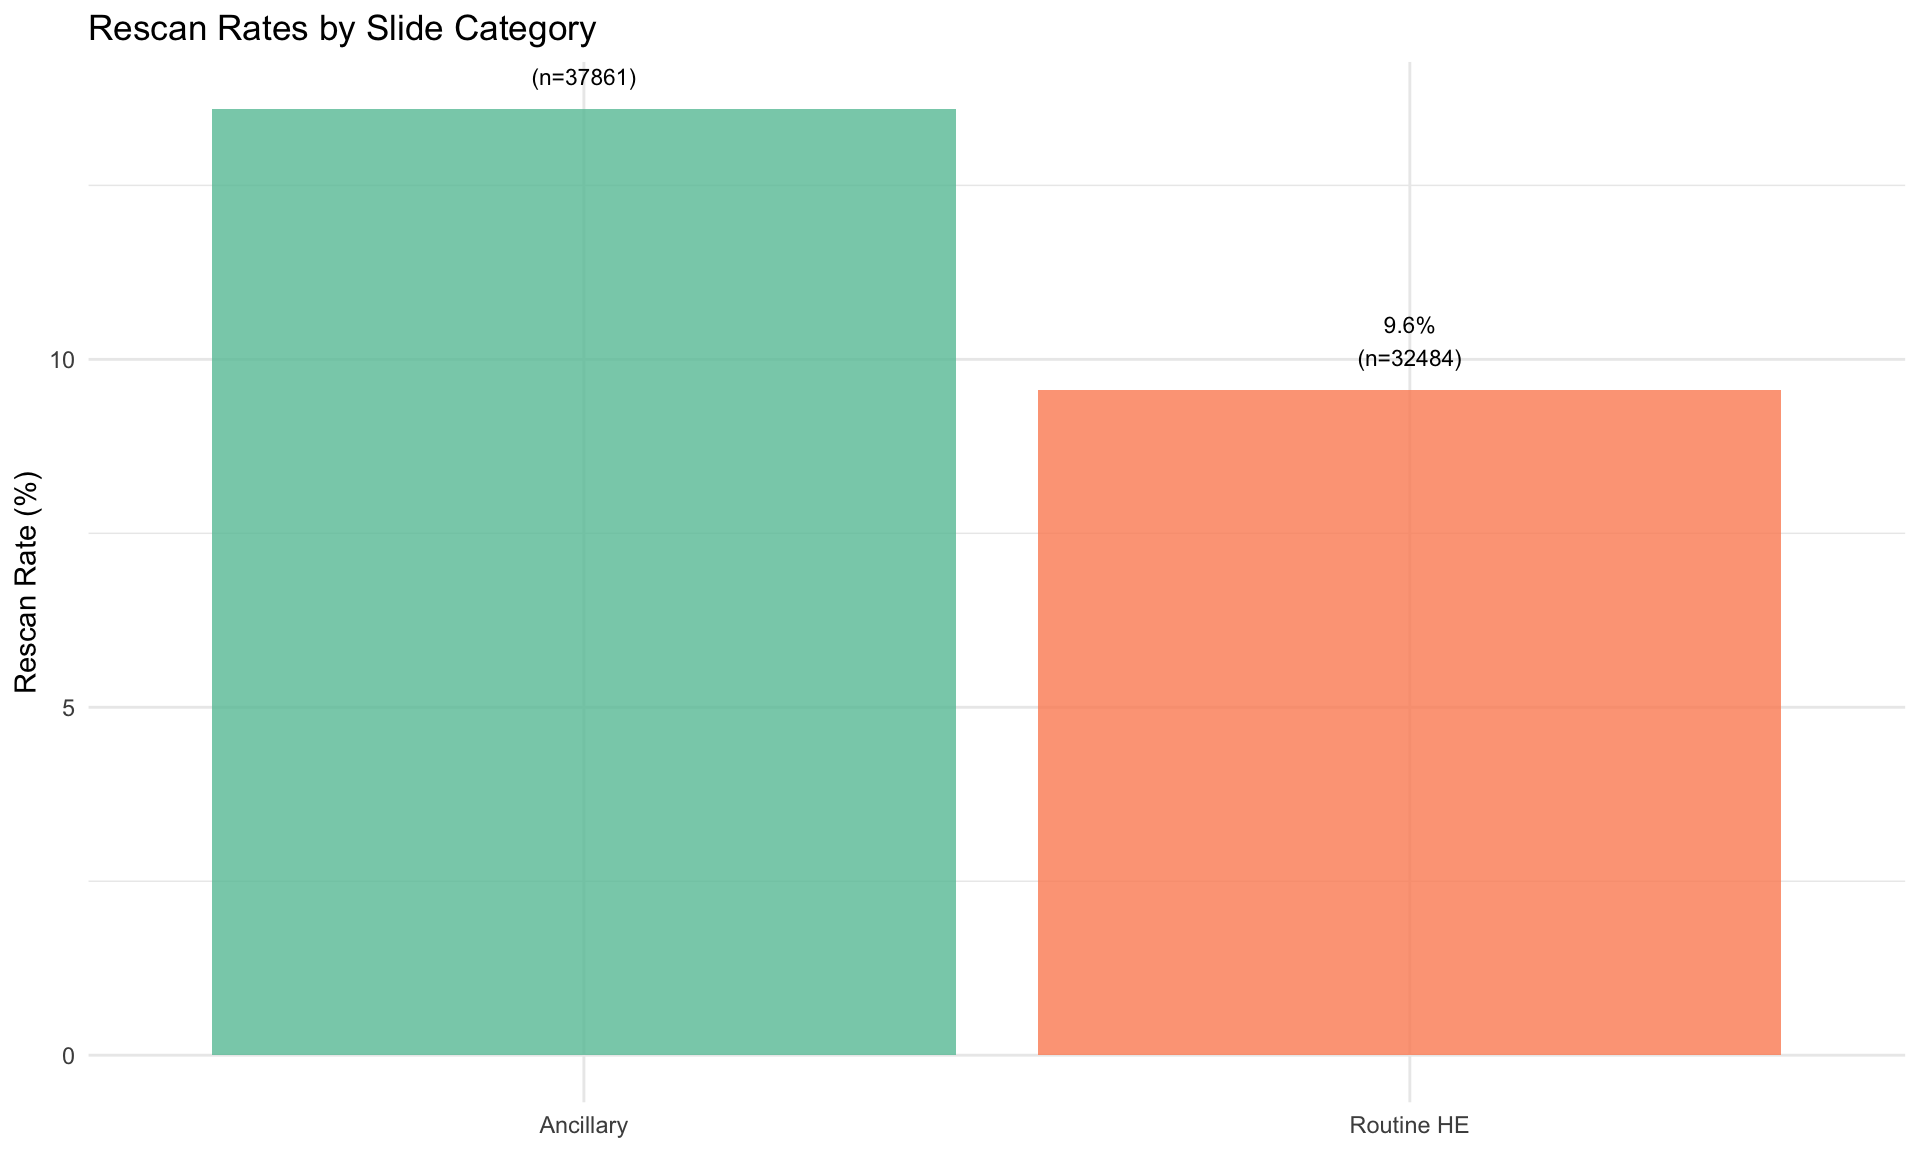
Key Finding: Are routine HE slides or ancillary stains more prone to rescans?
19.6 Scanner Performance Comparison
| Scanner | Total Slides | Rescanned | Rescan Rate (%) | First-Pass Success (%) | Avg Scans per Slide |
|---|---|---|---|---|---|
| SISLI_TECHNOMIND | 5 | 5 | 100.00 | 0.00 | 2.00 |
| SISLI_AT2_3 | 2345 | 1872 | 79.83 | 20.17 | 1.82 |
| SPIS_HM1 | 197 | 142 | 72.08 | 27.92 | 2.03 |
| SISLI_DEMO | 9 | 4 | 44.44 | 55.56 | 1.78 |
| BAH_ARG | 26 | 11 | 42.31 | 57.69 | 1.81 |
| BAH_ARG2 | 73 | 30 | 41.10 | 58.90 | 1.62 |
| SISLI_ARG | 27 | 10 | 37.04 | 62.96 | 1.81 |
| SISLI_HMMS | 703 | 165 | 23.47 | 76.53 | 1.61 |
| SISLI_AT2_2 | 79409 | 14175 | 17.85 | 82.15 | 1.20 |
| SISLI_MAG | 353 | 62 | 17.56 | 82.44 | 1.49 |
| SISLI | 779 | 104 | 13.35 | 86.65 | 1.53 |
| SISLI_AT2 | 115690 | 14515 | 12.55 | 87.45 | 1.15 |
| SISLI_MOTIC | 196 | 24 | 12.24 | 87.76 | 1.19 |
| SISLI_GT450 | 213858 | 21103 | 9.87 | 90.13 | 1.11 |
| SISLI_GT450_2 | 190842 | 17534 | 9.19 | 90.81 | 1.10 |
| SECTRA-PATO | 10213 | 511 | 5.00 | 95.00 | 1.07 |
| ANTALYA | 227 | 11 | 4.85 | 95.15 | 1.06 |
| SISLI_GT450_3 | 2541 | 59 | 2.32 | 97.68 | 1.02 |
| SISLI_CS2 | 810 | 8 | 0.99 | 99.01 | 1.01 |
| YSF1 | 1 | 0 | 0.00 | 100.00 | 1.00 |
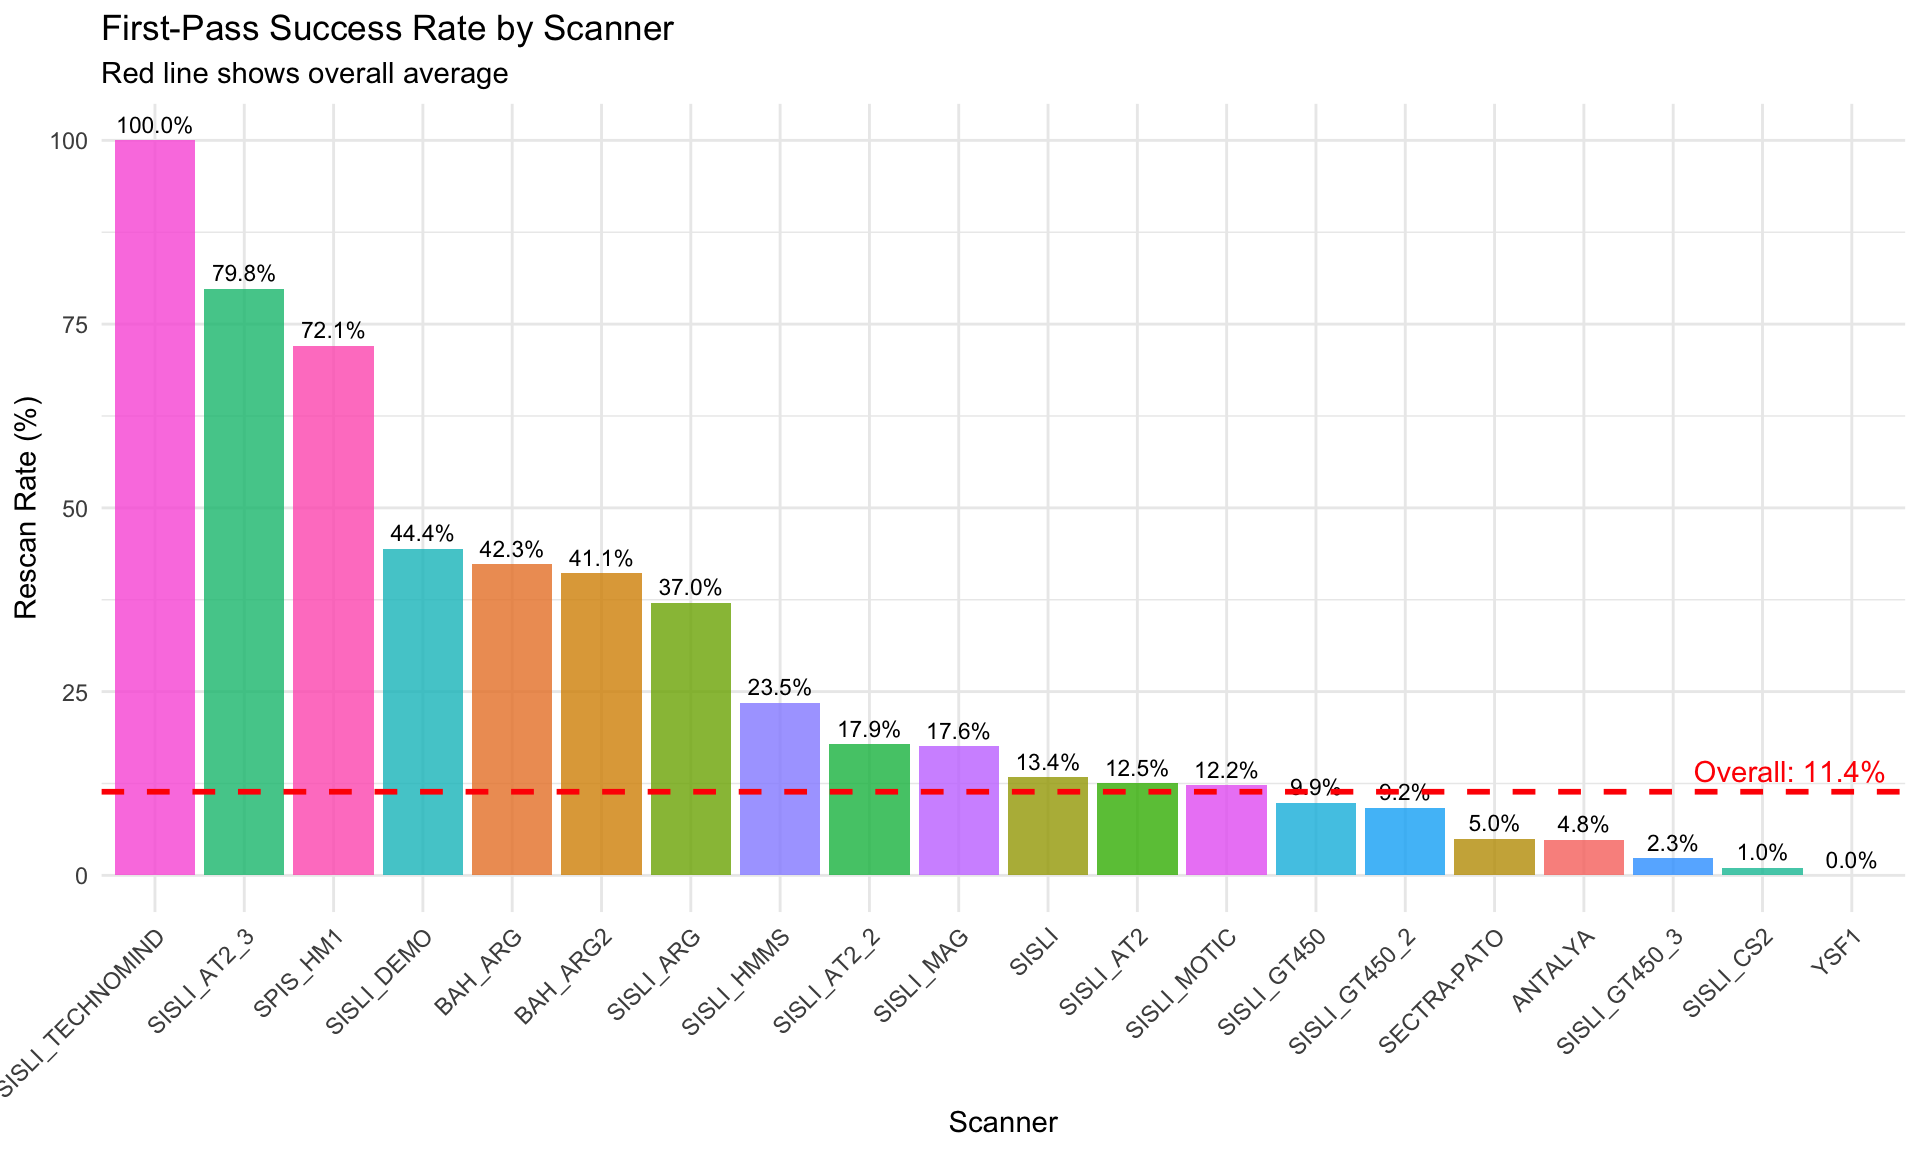
Clinical Implications: - Scanners with high rescan rates may need calibration or maintenance - Consistent underperformers should be investigated for hardware issues - Best performers can inform optimal scanning protocols
19.7 Temporal Patterns
19.7.1 Day of Week Analysis
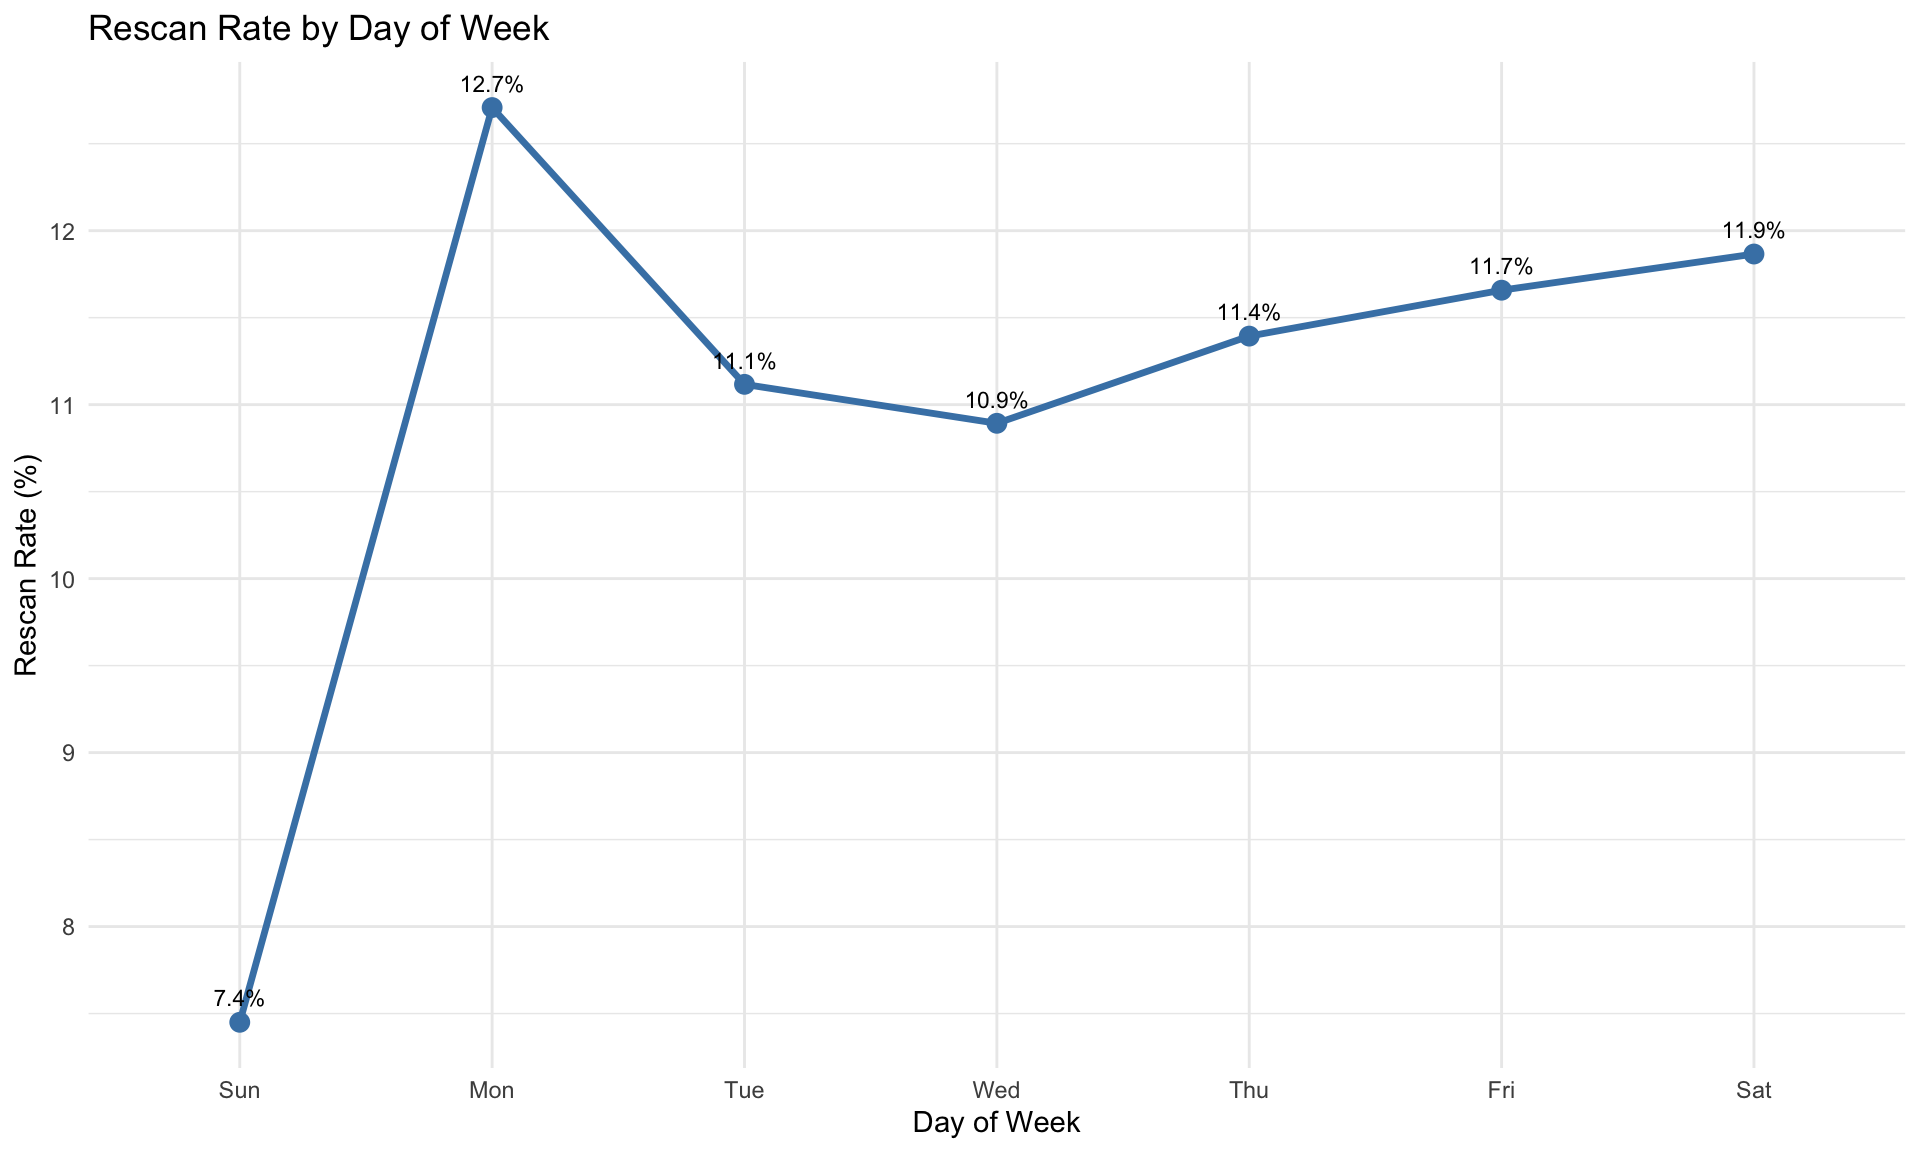
Questions to Ask: - Does Monday have higher rescan rates (weekend slide storage issues)? - Does Friday show lower quality (end-of-week fatigue)? - Are staffing levels consistent across days?
19.7.2 Hour of Day Analysis
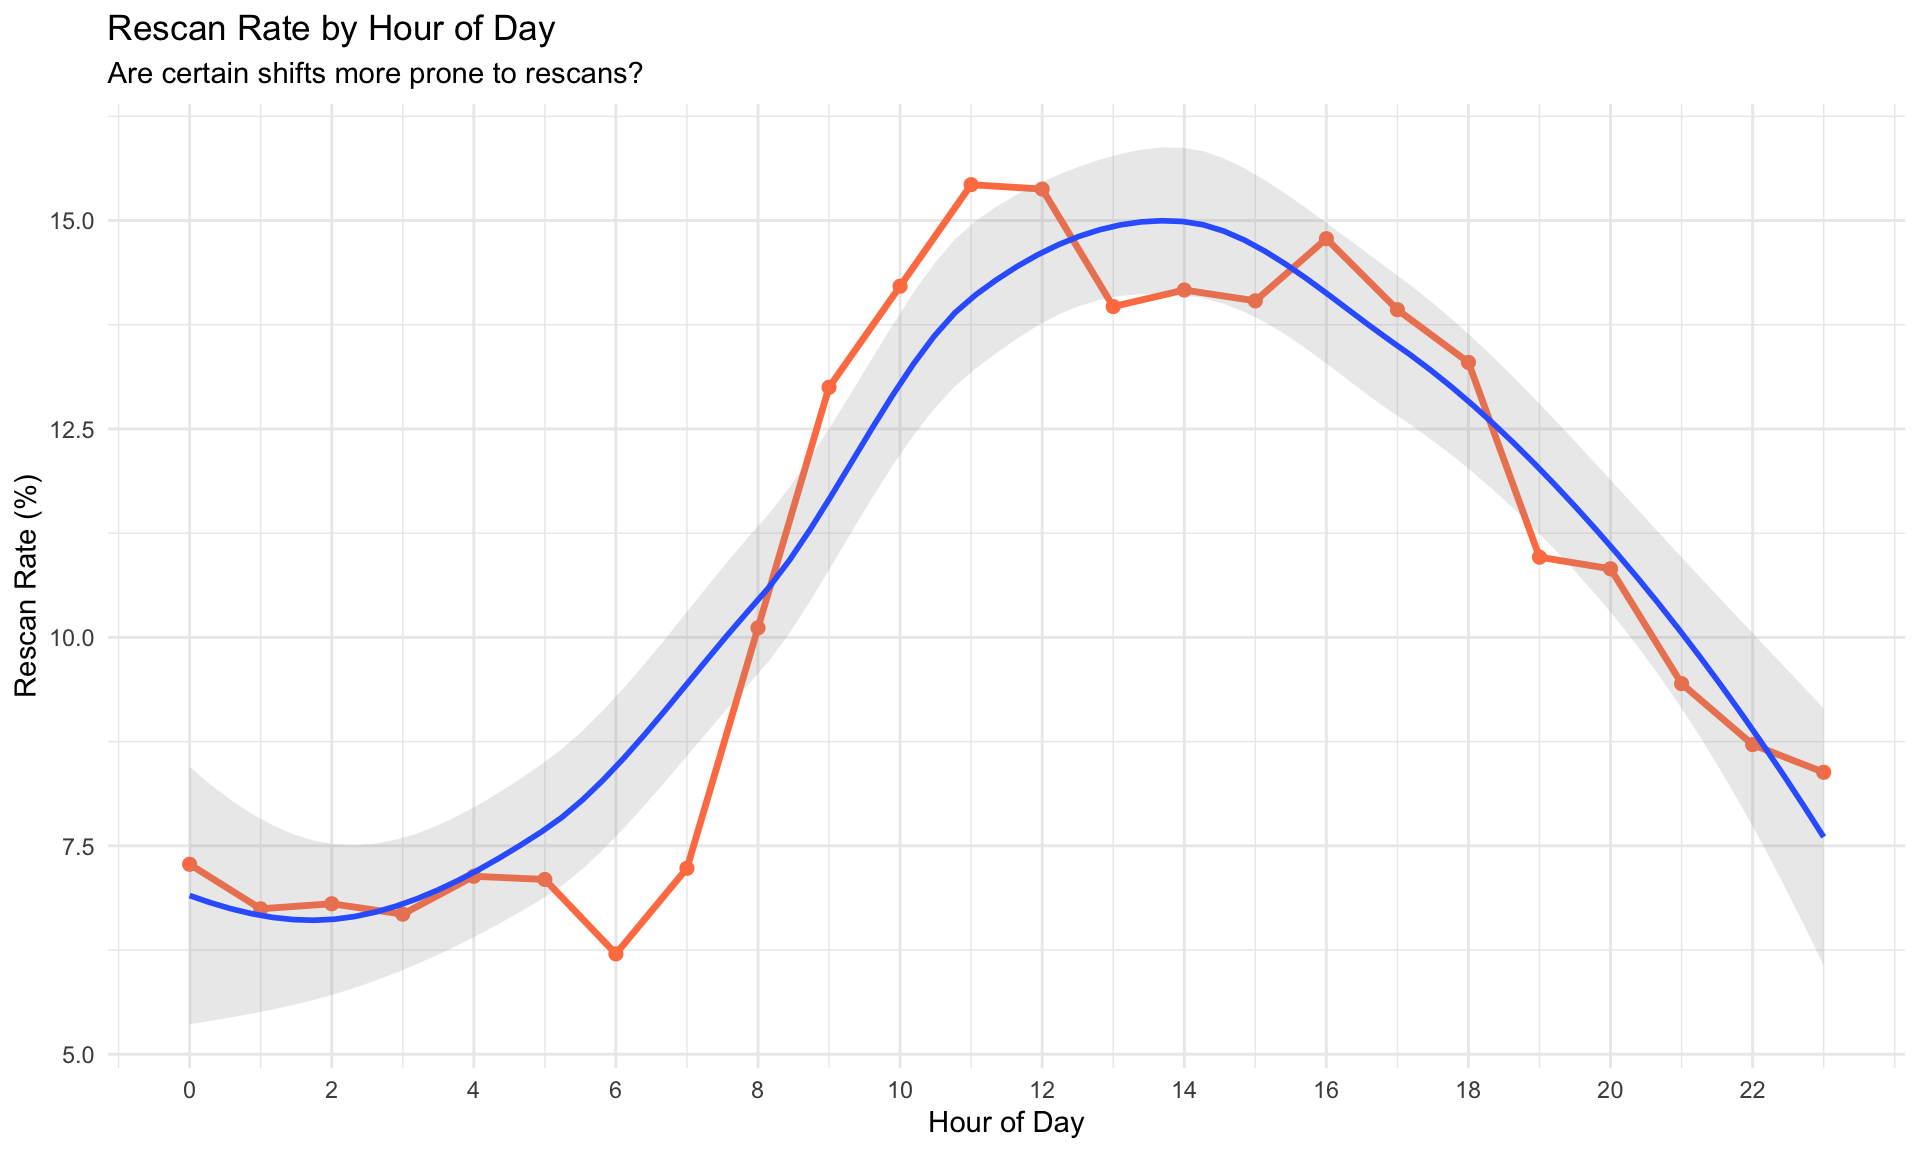
Operational Insights: - Night shift vs day shift quality differences - Fatigue effects during long shifts - Impact of lighting conditions on slide preparation
19.7.3 Monthly Trend
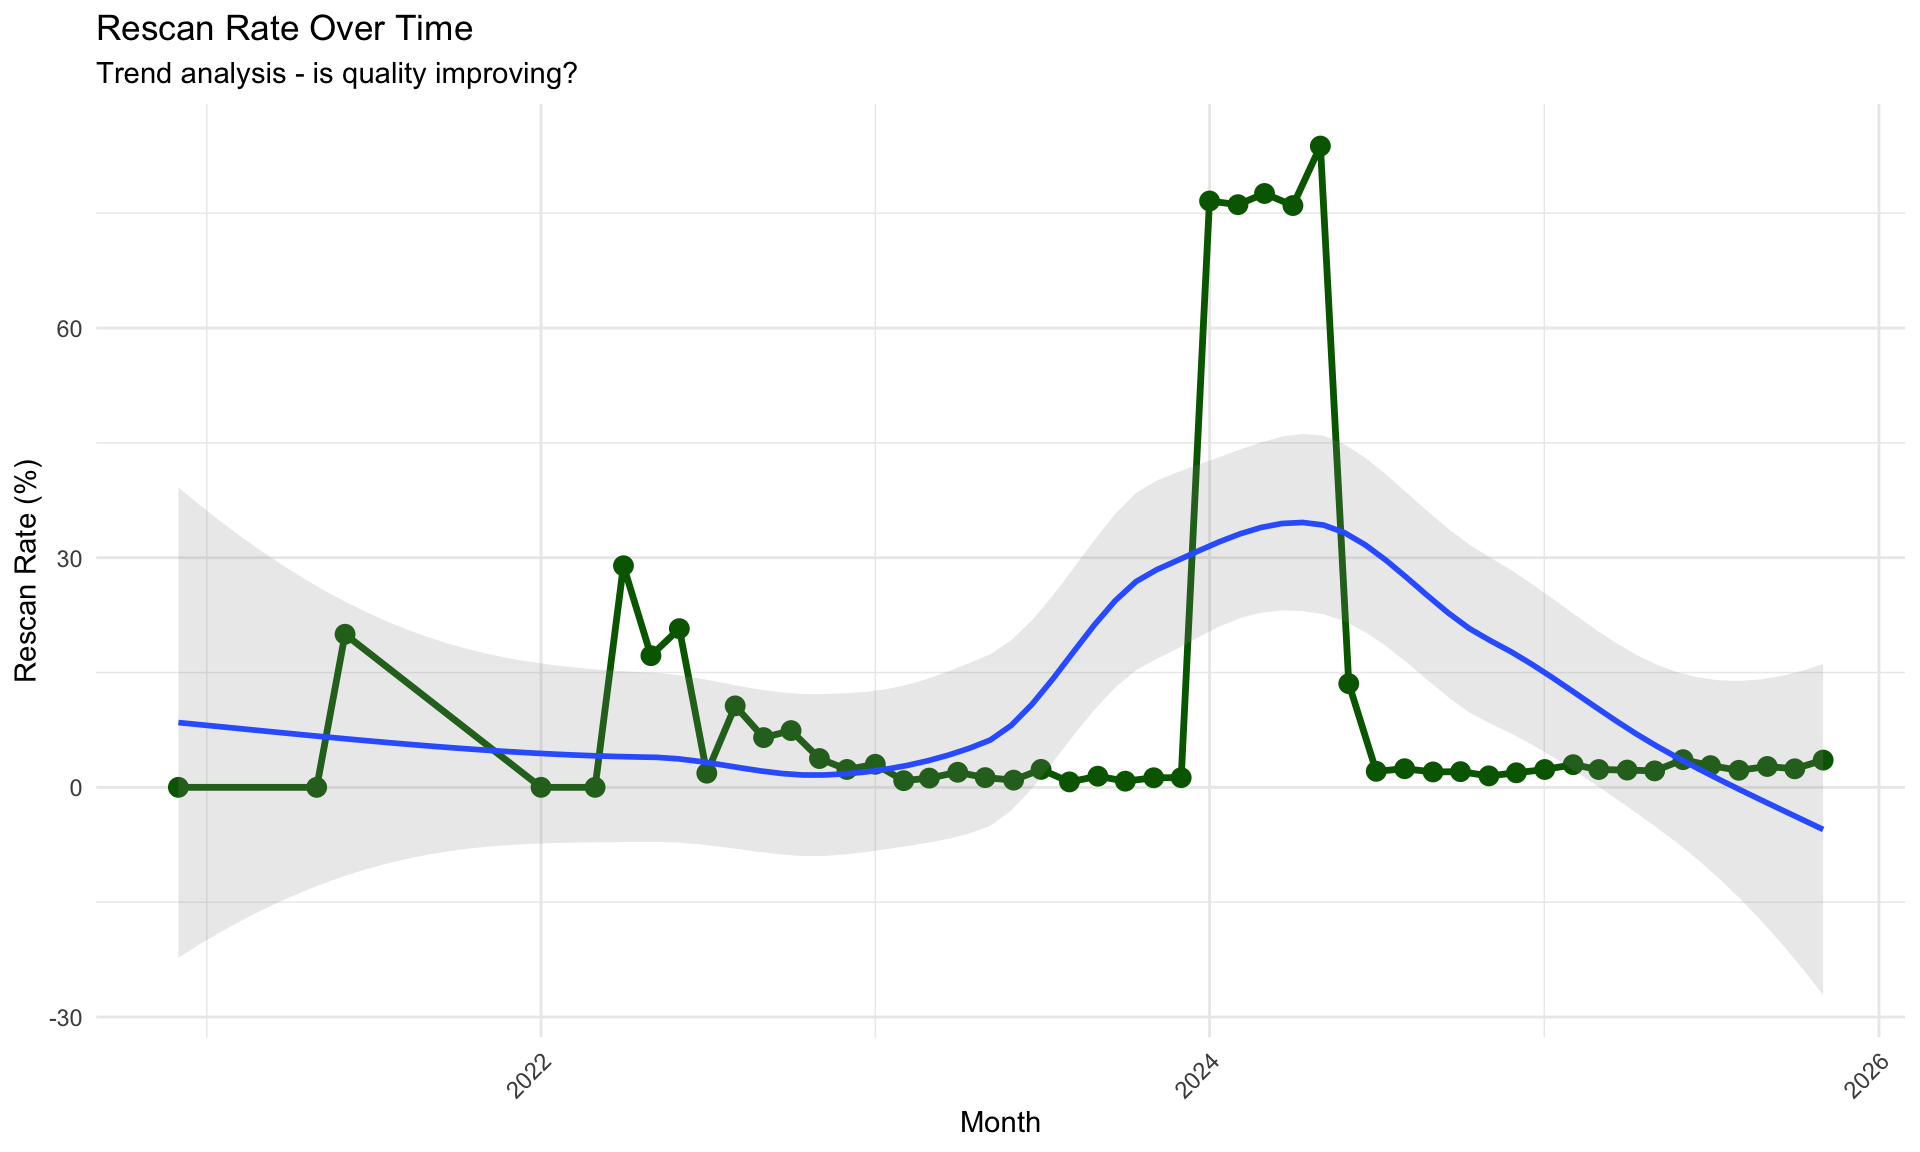
Strategic Questions: - Is quality improving over time (declining rescan rate)? - Do seasonal factors affect performance? - Did process changes impact rescan rates?
19.8 Cost Analysis
| Metric | Value |
|---|---|
| Cases Affected by Rescans | 20,536 |
| Total Rescan Events | 70,345 |
| Estimated Labor Cost (hours) | 5862.1 hrs (146.6 FTE weeks) |
| Estimated Delay Impact (hours) | 140690.0 hrs (5862.1 days) |
Assumptions: - 5 minutes average handling time per rescan (unloading, reloading, QC) - 2 hours average delay per rescanned slide (queue re-entry, priority handling)
Hidden Costs: - Pathologist waiting time - Technician interruption costs - Extended patient anxiety - Delayed treatment initiation
19.9 Root Cause Hypotheses
Based on the data, potential root causes for rescans include:
- Technical Issues
- Focus calibration problems
- Barcode reading failures
- Mechanical loading errors
- Slide Quality
- Inadequate tissue adhesion
- Coverslip bubbles or debris
- Staining artifacts (too light/dark)
- Operational Factors
- Rushed loading during peak hours
- Inadequate technician training
- Inconsistent quality standards
- Environmental
- Temperature/humidity variations
- Dust or contamination
- Equipment aging
19.10 Recommendations
19.10.1 Immediate Actions (High Priority)
- Investigate High-Rescan Scanners: Focus on scanners exceeding overall average
- Quality Control Review: Implement pre-scan inspection checklist
- Training Assessment: Review technician protocols, especially during problem shifts
- Preventive Maintenance: Schedule calibration for underperforming equipment
19.10.2 Short-Term Improvements
- Real-Time Monitoring: Dashboard showing rescan rates by shift and scanner
19.11 Causes of Rescans
We categorize reasons for rescans (e.g., “focus”, “tissue_detection”, “other”).
Common Industry Failure Modes: - ROI Detection Failures: ~64% - Tissue Skipping: ~23% - Barcode/Label Issues: ~0.5% (can be 20% in early implementations)
Understanding our specific failure modes allows for targeted interventions.
- Root Cause Tracking: Categorize rescan reasons (focus, loading, staining, etc.)
- Feedback Loop: Share performance metrics with lab staff
- Process Standardization: Document best practices from top performers
19.11.1 Long-Term Strategy
- Trend Analysis: Monthly review of rescan rates to track improvement
- Predictive QC: Use AI to flag slides likely to fail before scanning
- Equipment Investment: Consider replacing chronic underperformers
- Cost-Benefit Analysis: Evaluate impact of quality improvements on overall TAT
19.12 Requested Rescans (Pathologist Feedback)
We also analyze specific rescan requests filed by pathologists (“Geri Bildirim”). These represent cases where the initial scan was insufficient for diagnosis.
<table class="table table-striped table-hover" style="margin-left: auto; margin-right: auto;">
<caption>Top 10 Pathologists Requesting Rescans</caption>
 <thead>
  <tr>
   <th style="text-align:left;"> requesting_pathologist </th>
   <th style="text-align:right;"> n </th>
  </tr>
 </thead>
<tbody>
  <tr>
   <td style="text-align:left;"> Türkan Atasever Rezanko </td>
   <td style="text-align:right;"> 68 </td>
  </tr>
  <tr>
   <td style="text-align:left;"> Şemsi Yıldız </td>
   <td style="text-align:right;"> 49 </td>
  </tr>
  <tr>
   <td style="text-align:left;"> Murat Oktay </td>
   <td style="text-align:right;"> 47 </td>
  </tr>
  <tr>
   <td style="text-align:left;"> Doç. Dr. Serdar Balcı </td>
   <td style="text-align:right;"> 43 </td>
  </tr>
  <tr>
   <td style="text-align:left;"> Gülen Bülbül Doğusoy </td>
   <td style="text-align:right;"> 35 </td>
  </tr>
  <tr>
   <td style="text-align:left;"> Prof. Dr. Türkan Atasever Rezanko </td>
   <td style="text-align:right;"> 35 </td>
  </tr>
  <tr>
   <td style="text-align:left;"> Uzm. Dr. Fadime Gül Salman </td>
   <td style="text-align:right;"> 31 </td>
  </tr>
  <tr>
   <td style="text-align:left;"> Uzm. Dr. Emre Karakök </td>
   <td style="text-align:right;"> 29 </td>
  </tr>
  <tr>
   <td style="text-align:left;"> Prof. Dr. Gülen Bülbül Doğusoy </td>
   <td style="text-align:right;"> 25 </td>
  </tr>
  <tr>
   <td style="text-align:left;"> Prof.dr. Fatma Aktepe </td>
   <td style="text-align:right;"> 25 </td>
  </tr>
</tbody>
</table><table class="table table-striped table-hover" style="margin-left: auto; margin-right: auto;">
<caption>Top 10 Reasons for Rescan Requests</caption>
 <thead>
  <tr>
   <th style="text-align:left;"> description </th>
   <th style="text-align:right;"> n </th>
  </tr>
 </thead>
<tbody>
  <tr>
   <td style="text-align:left;"> net olmamış </td>
   <td style="text-align:right;"> 7 </td>
  </tr>
  <tr>
   <td style="text-align:left;"> sb </td>
   <td style="text-align:right;"> 7 </td>
  </tr>
  <tr>
   <td style="text-align:left;"> bulanık </td>
   <td style="text-align:right;"> 4 </td>
  </tr>
  <tr>
   <td style="text-align:left;"> giemsa taranmamış </td>
   <td style="text-align:right;"> 4 </td>
  </tr>
  <tr>
   <td style="text-align:left;"> kullanılamaz görüntü olmuş. tekrar tarar mısınız </td>
   <td style="text-align:right;"> 4 </td>
  </tr>
  <tr>
   <td style="text-align:left;"> net olmamiş </td>
   <td style="text-align:right;"> 4 </td>
  </tr>
  <tr>
   <td style="text-align:left;"> ss </td>
   <td style="text-align:right;"> 4 </td>
  </tr>
  <tr>
   <td style="text-align:left;"> dr nural </td>
   <td style="text-align:right;"> 3 </td>
  </tr>
  <tr>
   <td style="text-align:left;"> net değil, tekrar taransın </td>
   <td style="text-align:right;"> 3 </td>
  </tr>
  <tr>
   <td style="text-align:left;"> bulanik </td>
   <td style="text-align:right;"> 2 </td>
  </tr>
</tbody>
</table>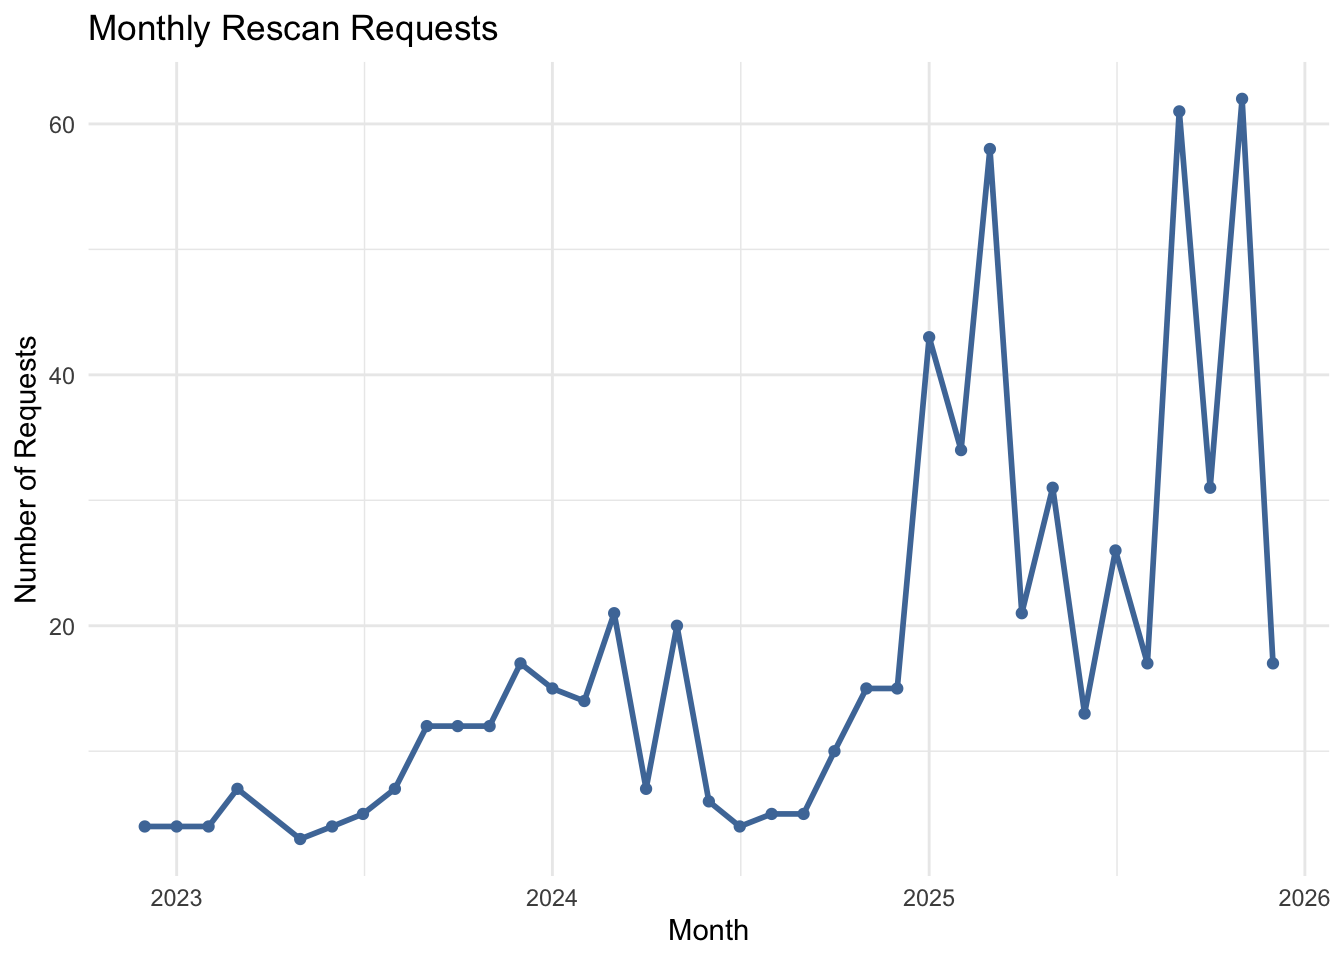
19.13 Benchmarking
Industry standards for digital pathology rescan rates (Asta Report 2025): - Excellent: <1.5% rescan rate - Acceptable: 1.5-3.0% rescan rate - Needs Improvement: 3.0-5.0% rescan rate - Critical: >5.0% rescan rate
Current Performance:
Your rescan rate: 11.38% - Critical ✗19.14 Conclusion
Rescan analysis reveals both quality metrics and operational efficiency. By systematically tracking and reducing rescans, laboratories can: - Improve turnaround times - Reduce operational costs - Enhance diagnostic confidence - Optimize resource utilization
The goal is continuous improvement toward <2% rescan rate while maintaining diagnostic quality.