| Delayed | On-Time | |
|---|---|---|
| Delayed | 447 | 4501 |
| On-Time | 11 | 18 |
23 Predictive Modeling for TAT
23.1 Introduction
Predictive modeling enables proactive management by forecasting turnaround times and identifying at-risk cases before delays occur.
23.2 Load and Build Models
23.3 Model Performance
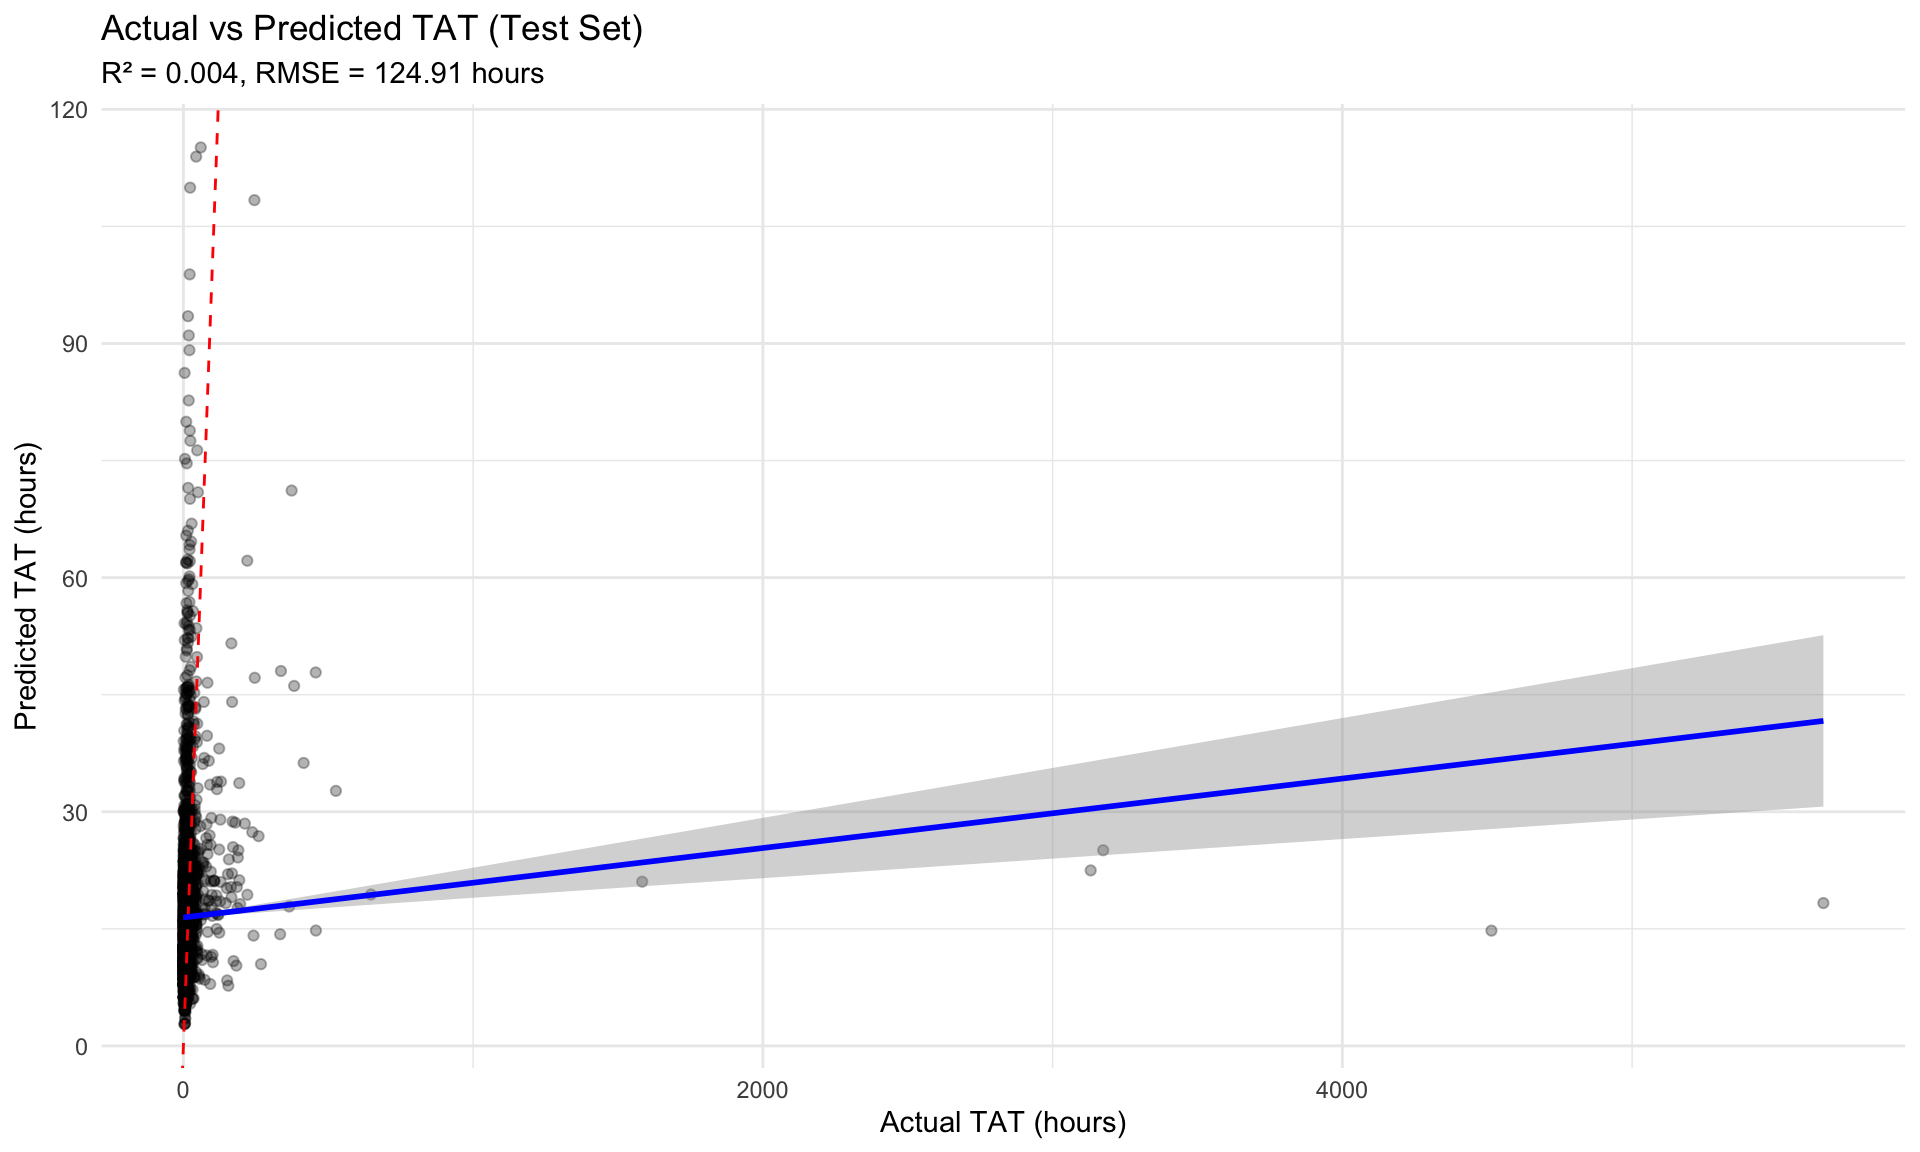
Regression Model (TAT Prediction): - Train R²: 0.004 - Test R²: 0.004 - Test RMSE: 124.91 hours
Classification Model (Delay Prediction): - Accuracy: 9.3%
23.4 Actual vs Predicted
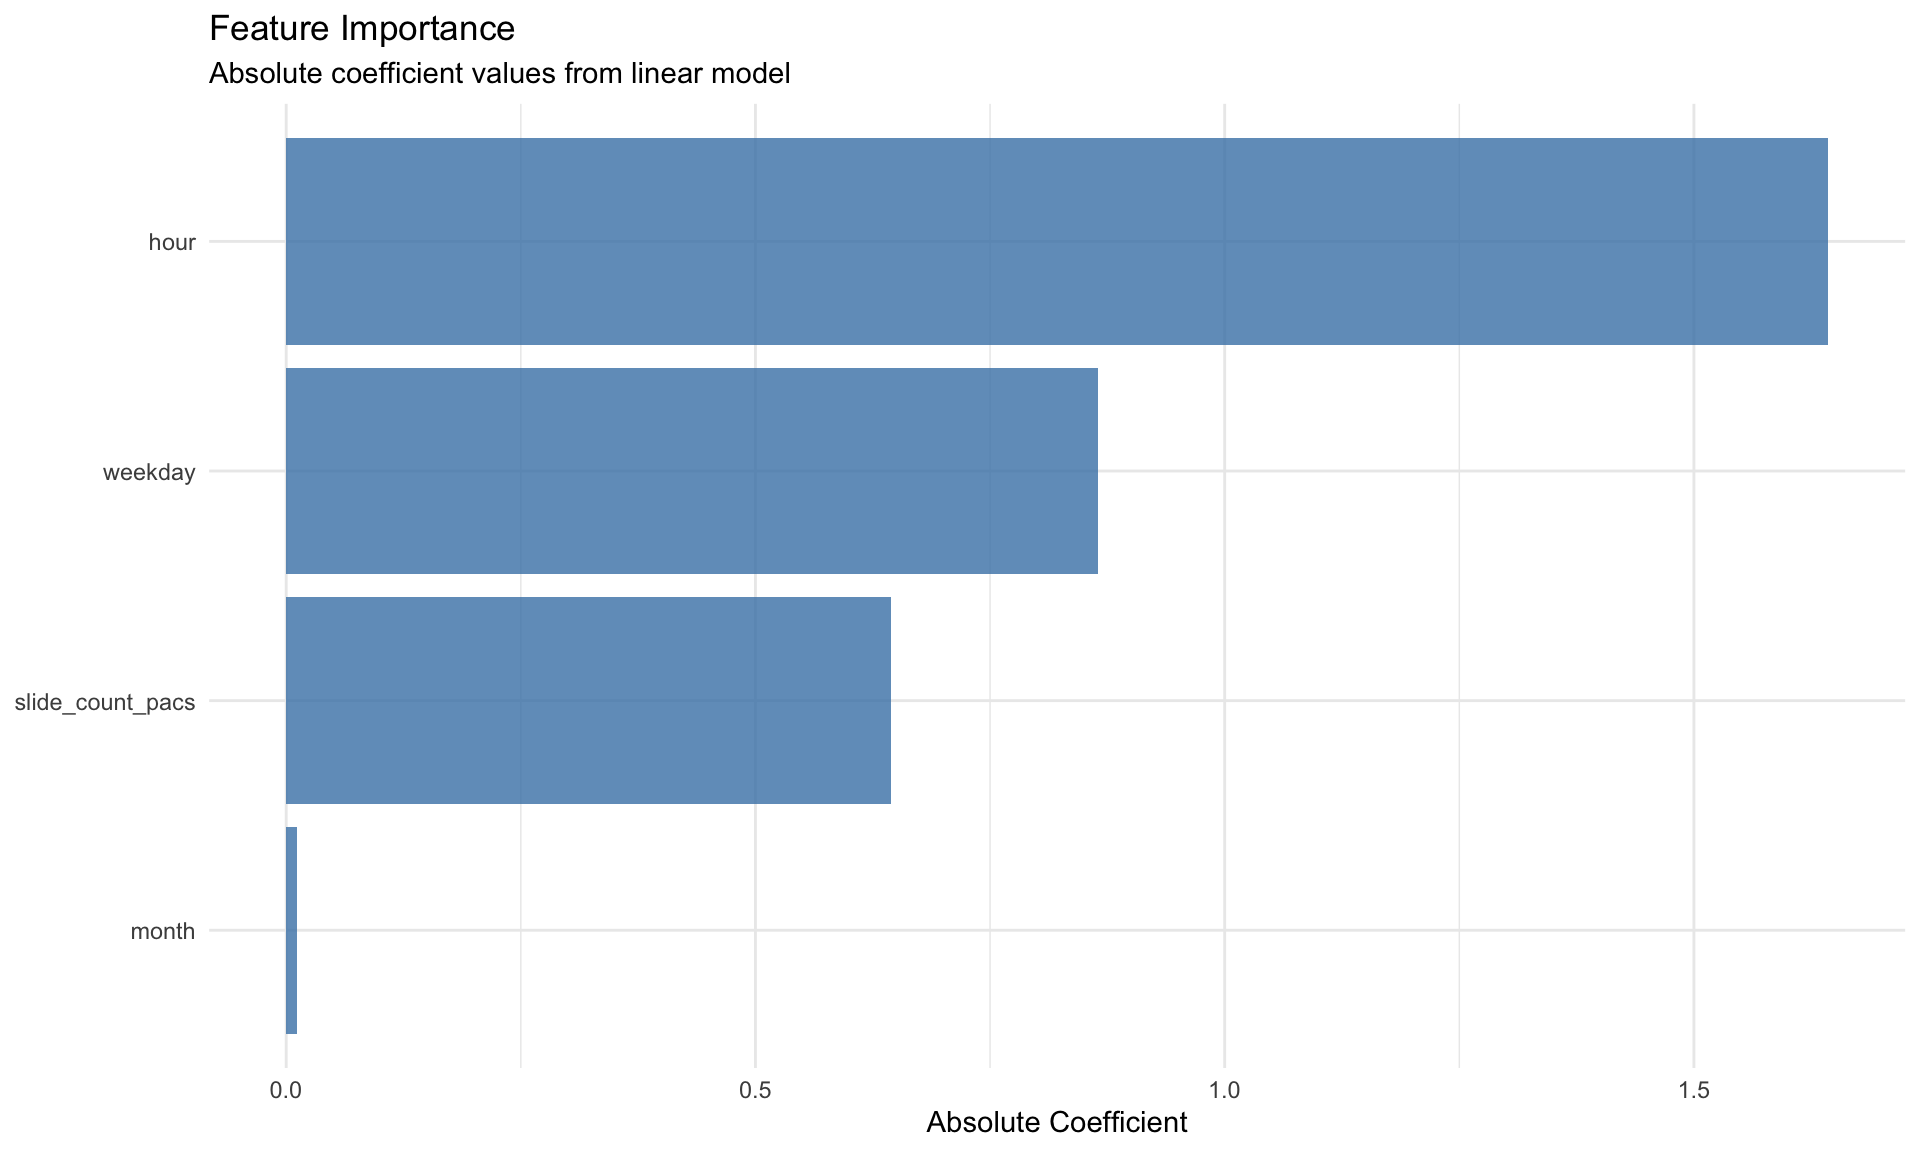
23.5 Feature Importance
23.6 Risk Stratification
| risk_category | n_cases | actual_delays | delay_rate |
|---|---|---|---|
| High Risk | 4892 | 432 | 8.8 |
| Low Risk | 12 | 5 | 41.7 |
| Medium Risk | 73 | 21 | 28.8 |
Application: Use delay probability to prioritize cases for expedited processing.