8 Analyze PACS Data
8.1 Introduction
We analyze the PACS data to understand the volume of uploaded cases and the distribution of scanner models used.
8.2 Analysis
We load the analysis script and the processed data.
8.2.1 Daily PACS Upload Volume
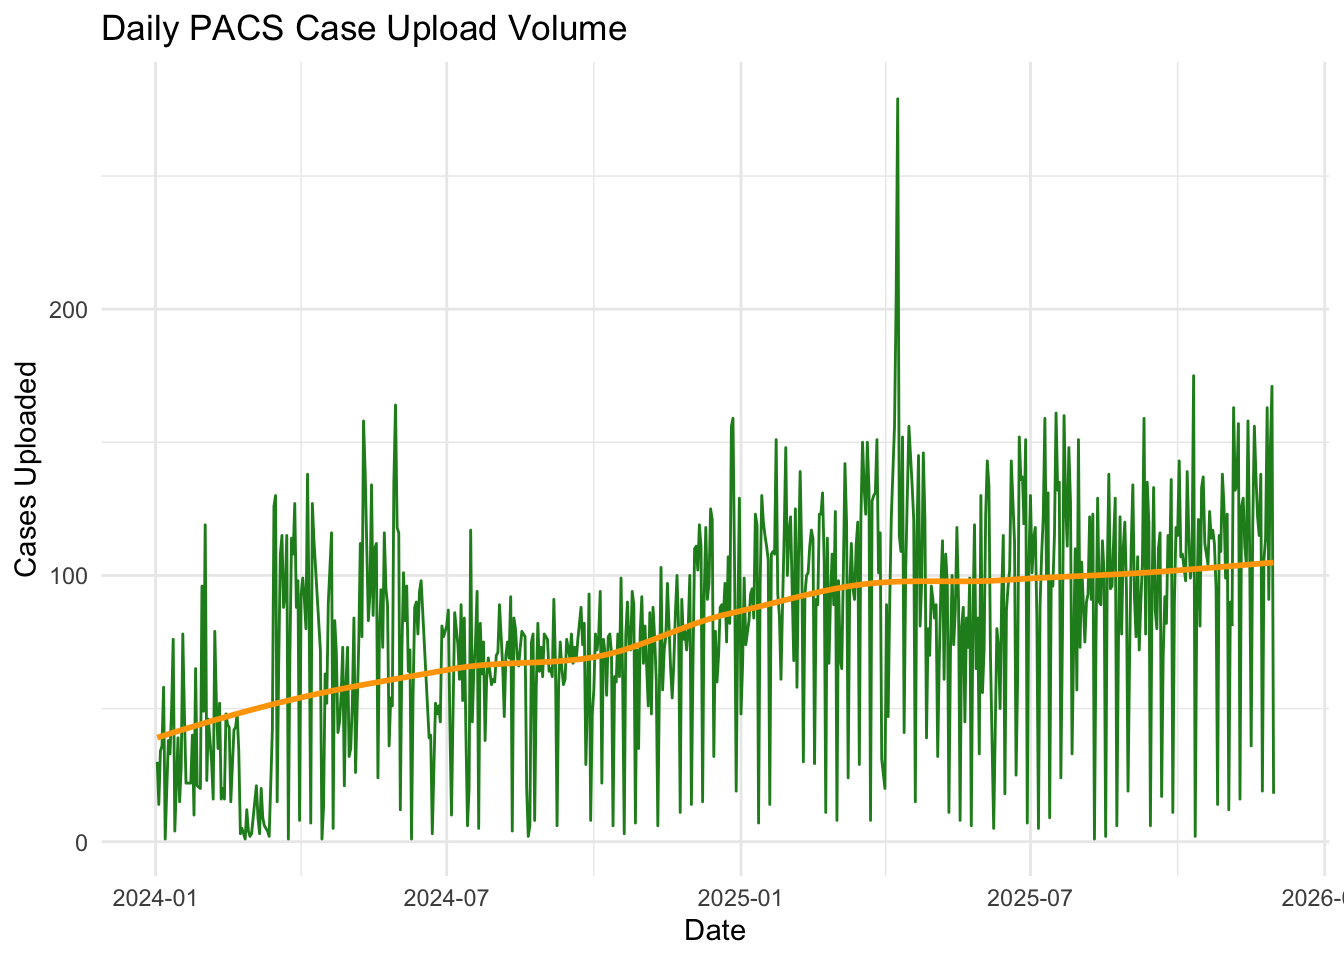
The following plot shows the daily volume of cases uploaded to PACS.
8.2.2 Scanner Model Distribution
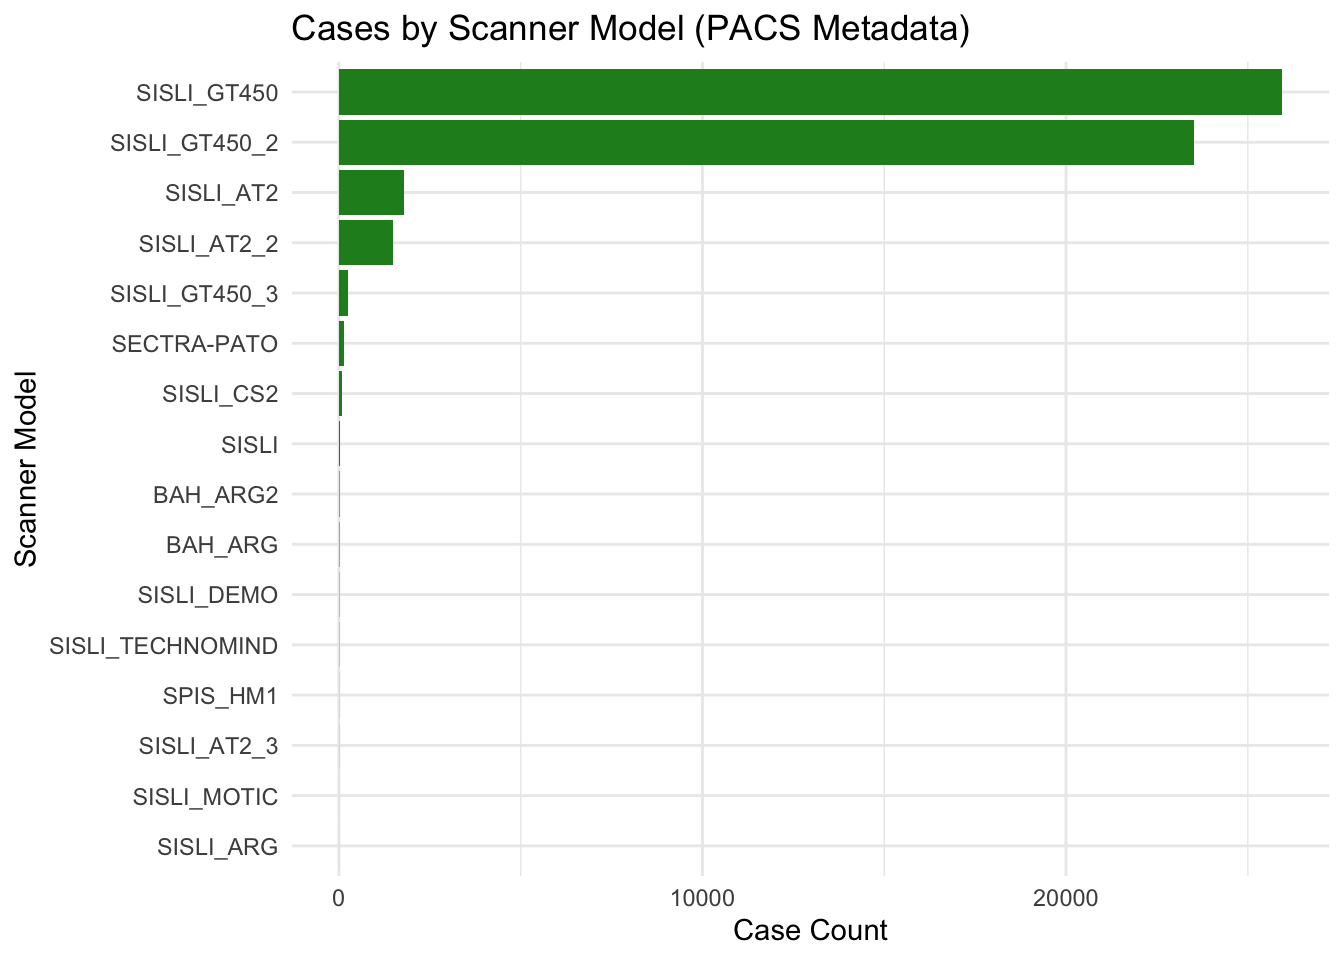
The following plot shows the distribution of scanner models identified in the PACS metadata.
8.2.3 Summary Statistics
Summary statistics for daily PACS upload volume:
   Min. 1st Qu.  Median    Mean 3rd Qu.    Max.
   1.00   54.25   83.00   80.53  111.00  279.00