24 Outlier Investigation
24.1 Introduction
Understanding outliers reveals both exceptional performance and critical failures. Learn from best performers and prevent worst-case scenarios.
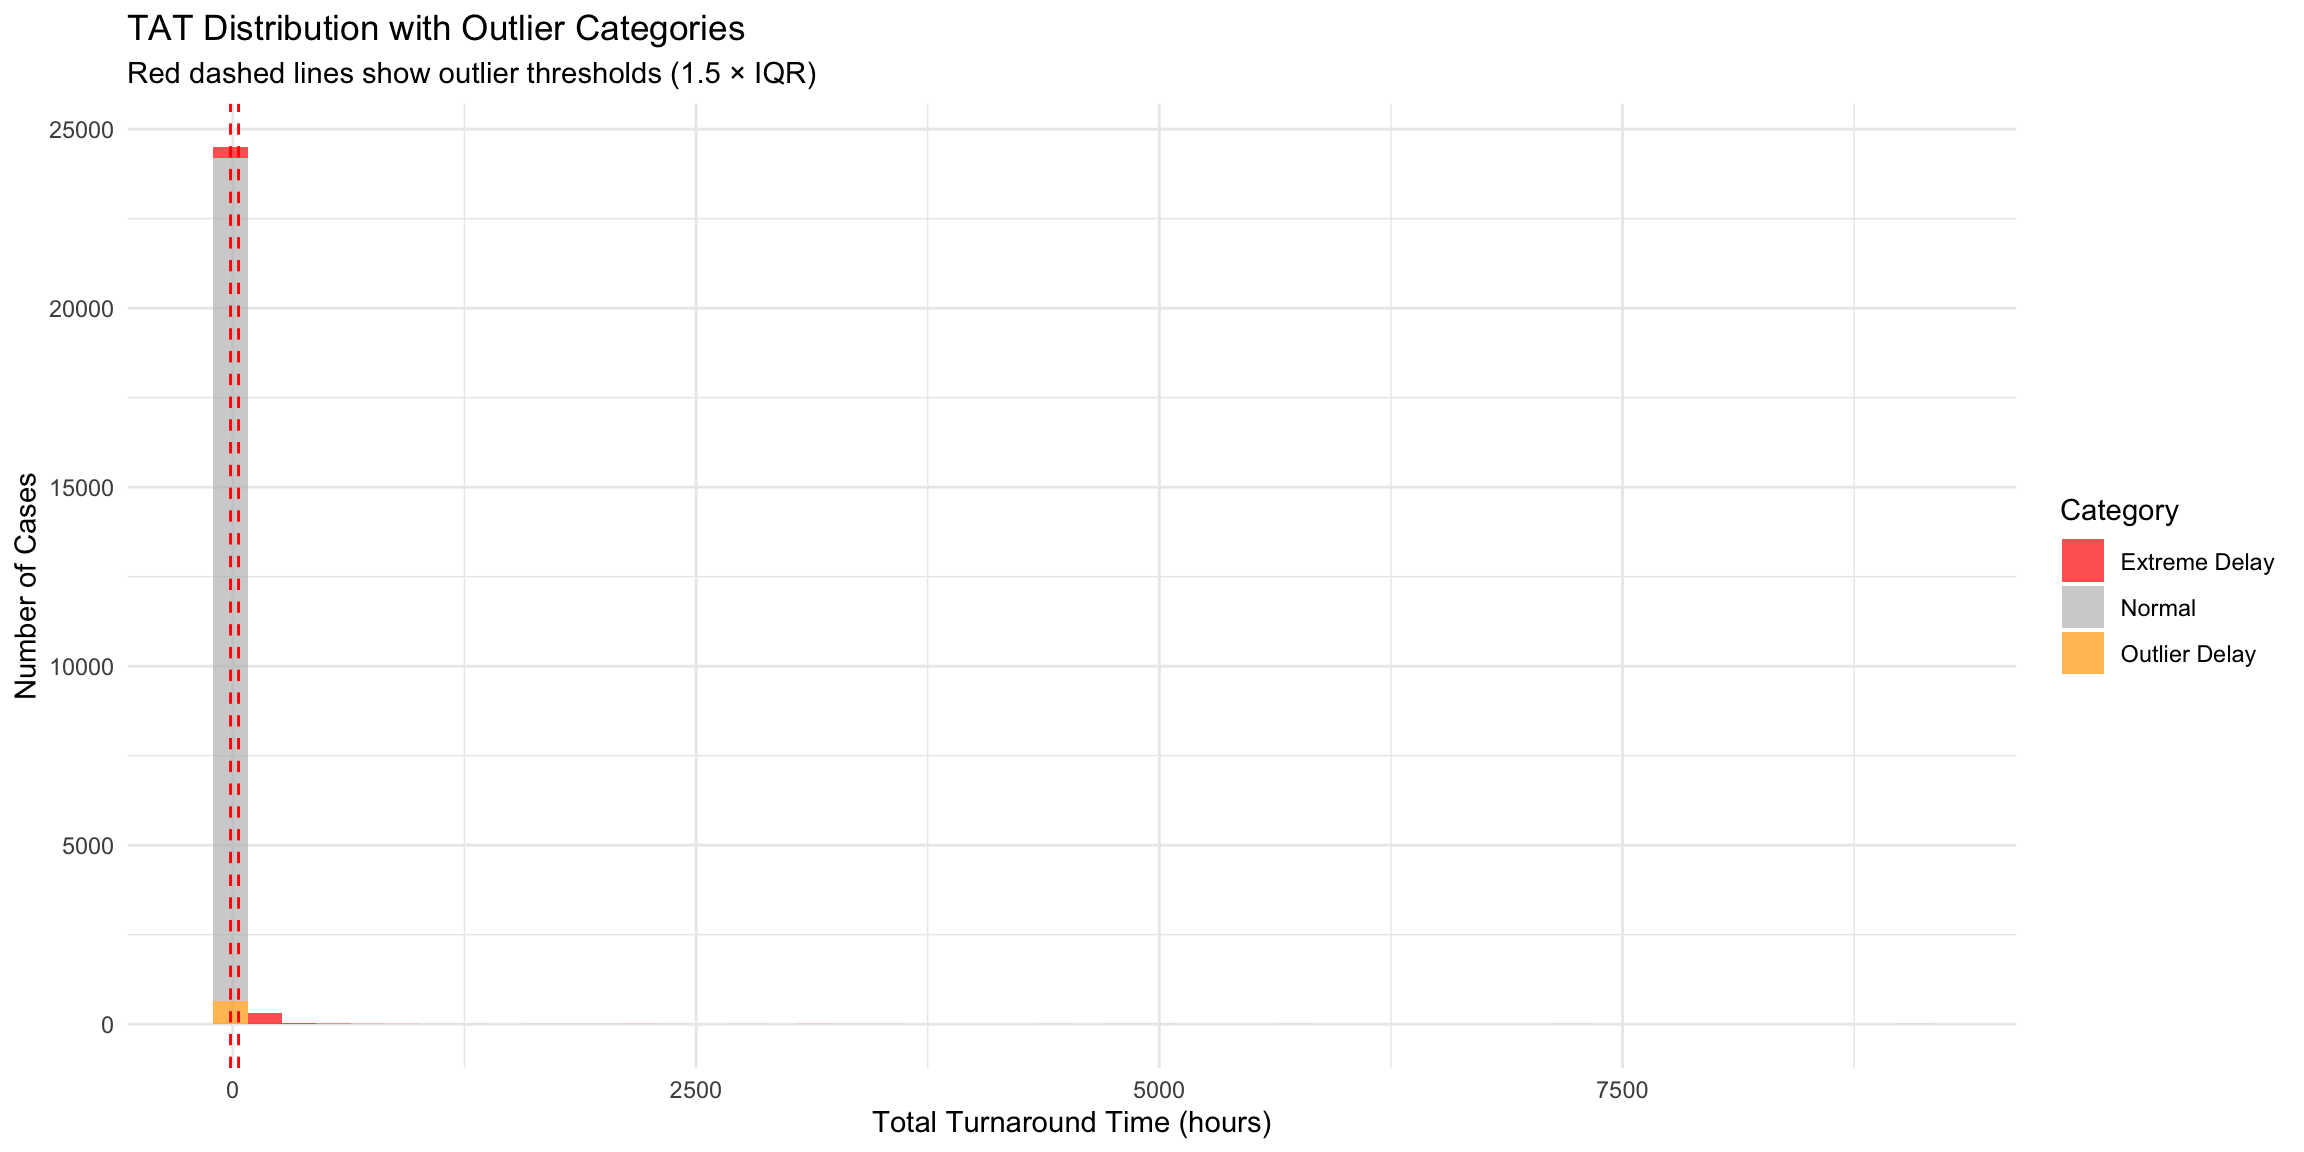
24.2 Outlier Distribution
24.3 Outlier Summary
| outlier_category | n_cases | pct_of_total | avg_tat | median_tat | avg_slides |
|---|---|---|---|---|---|
| Extreme Delay | 691 | 1.45 | 254.82 | 93.28 | 18.38 |
| Outlier Delay | 654 | 1.37 | 37.42 | 36.01 | 12.61 |
| Normal | 46414 | 97.18 | 9.12 | 7.49 | 5.66 |
24.4 Best Performers (Top 5%)
| erisim_numarasi | time_total_turnaround | time_lab_to_scan | time_scan_duration | time_scan_to_pacs | slide_count_pacs | scanner_model_pacs |
|---|---|---|---|---|---|---|
| 42040-24 | 0.00 | NA | NA | NA | 2 | SISLI_GT450_2 |
| 37471-24 | 0.00 | NA | NA | NA | 2 | SISLI_GT450_2 |
| 25980-24 | 0.00 | NA | NA | NA | 4 | SISLI_GT450_2 |
| 35672-24 | 0.00 | NA | NA | NA | 4 | SISLI_GT450 |
| 9303-25 | 0.00 | NA | NA | NA | 4 | SISLI_GT450 |
| 5927-25 | 0.00 | NA | NA | NA | 1 | SISLI_GT450 |
| 55621-24 | 0.01 | NA | NA | NA | 3 | SISLI_GT450 |
| 14113-25 | 0.01 | NA | NA | NA | 2 | SISLI_GT450_2 |
| 35154-24 | 0.01 | NA | NA | NA | 2 | SISLI_GT450_2 |
| 64017-24 | 0.01 | NA | NA | NA | 5 | SISLI_GT450 |
24.5 Worst Performers (Top 5% Delays)
| erisim_numarasi | time_total_turnaround | time_lab_to_scan | time_scan_duration | time_scan_to_pacs | slide_count_pacs | scanner_model_pacs | turnaround_category |
|---|---|---|---|---|---|---|---|
| 25912-24 | 9069.38 | NA | NA | NA | 9 | SISLI_GT450_2 | Extreme (>7 Days) |
| 17452-24 | 9047.01 | NA | NA | NA | 1 | SISLI_GT450 | Extreme (>7 Days) |
| 29817-24 | 7274.26 | NA | NA | NA | 47 | SISLI_GT450_2 | Extreme (>7 Days) |
| 19808-24 | 5660.18 | NA | NA | NA | 3 | SISLI_GT450_2 | Extreme (>7 Days) |
| 17111-24 | 4932.04 | NA | NA | NA | 16 | SISLI_AT2 | Extreme (>7 Days) |
| 17957-24 | 4809.03 | NA | NA | NA | 12 | SISLI_AT2 | Extreme (>7 Days) |
| 33794-24 | 4514.57 | NA | NA | NA | 5 | SISLI_GT450_2 | Extreme (>7 Days) |
| 79-25 | 3454.28 | NA | NA | NA | 4 | SISLI_GT450_2 | Extreme (>7 Days) |
| 46065-24 | 3256.30 | NA | NA | NA | 38 | SISLI_GT450_2 | Extreme (>7 Days) |
| 58143-24 | 3190.24 | NA | NA | NA | 1 | SISLI_GT450_2 | Extreme (>7 Days) |
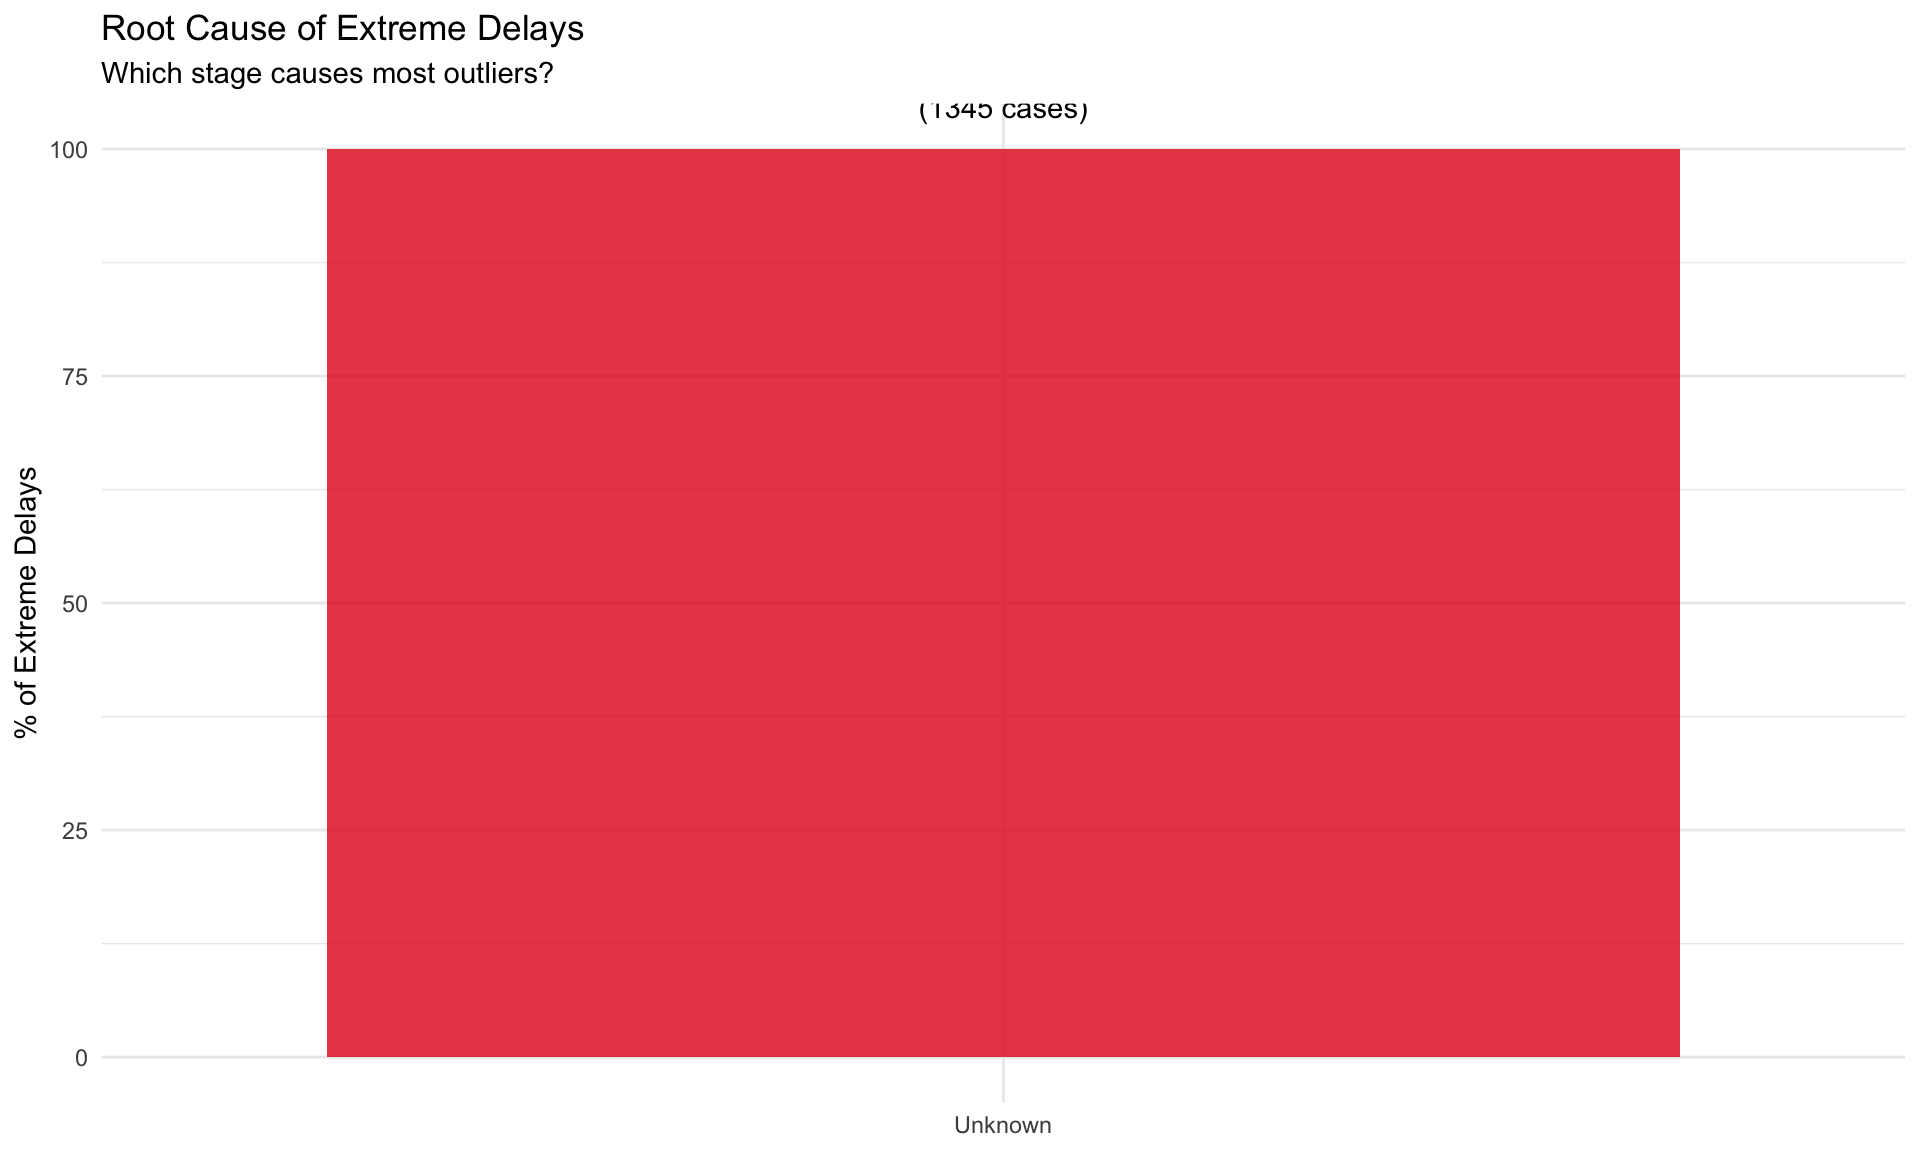
24.6 Root Cause of Extreme Delays
24.7 Characteristics of Extreme Delays
| Metric | Value |
|---|---|
| n_cases | 1345.00 |
| median_lab_to_scan | NA |
| median_scan_duration | NA |
| median_scan_to_pacs | NA |
| avg_slides | 15.58 |
| pct_weekend | 18.51 |
24.8 Action Plan
For Best Performers: Document and replicate success factors
For Worst Performers: Investigate specific cases, implement preventive measures