4 Analyze Lab Data
4.1 Introduction
We analyze the lab data to understand the volume of cases and the timing of staining completion.
4.2 Analysis
We load the analysis script and the processed data.
4.2.1 Daily Case Volume
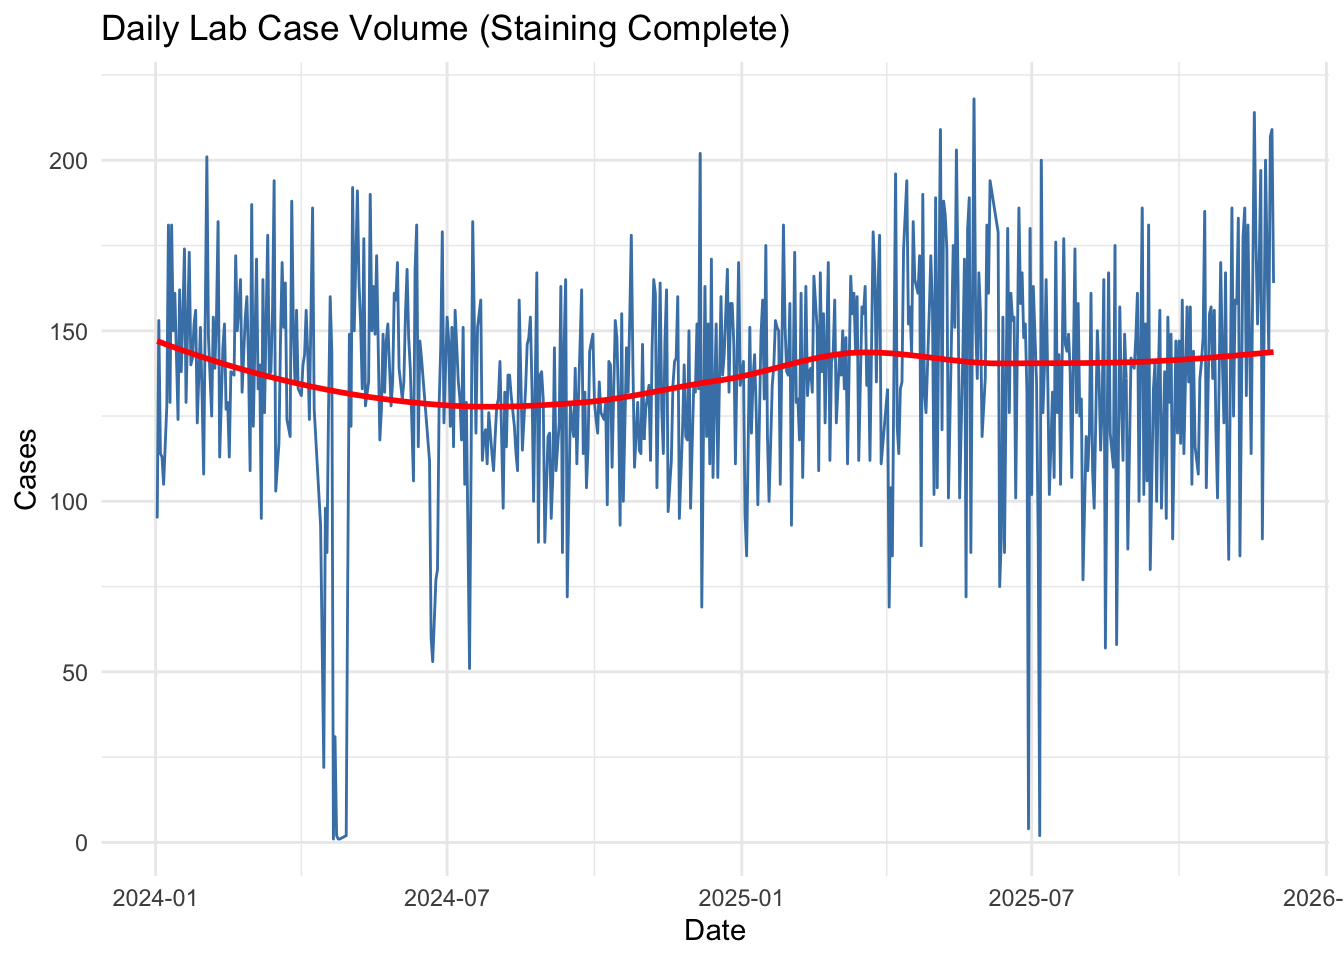
The following plot shows the daily volume of cases where staining was completed.
4.2.2 Completion Time of Day
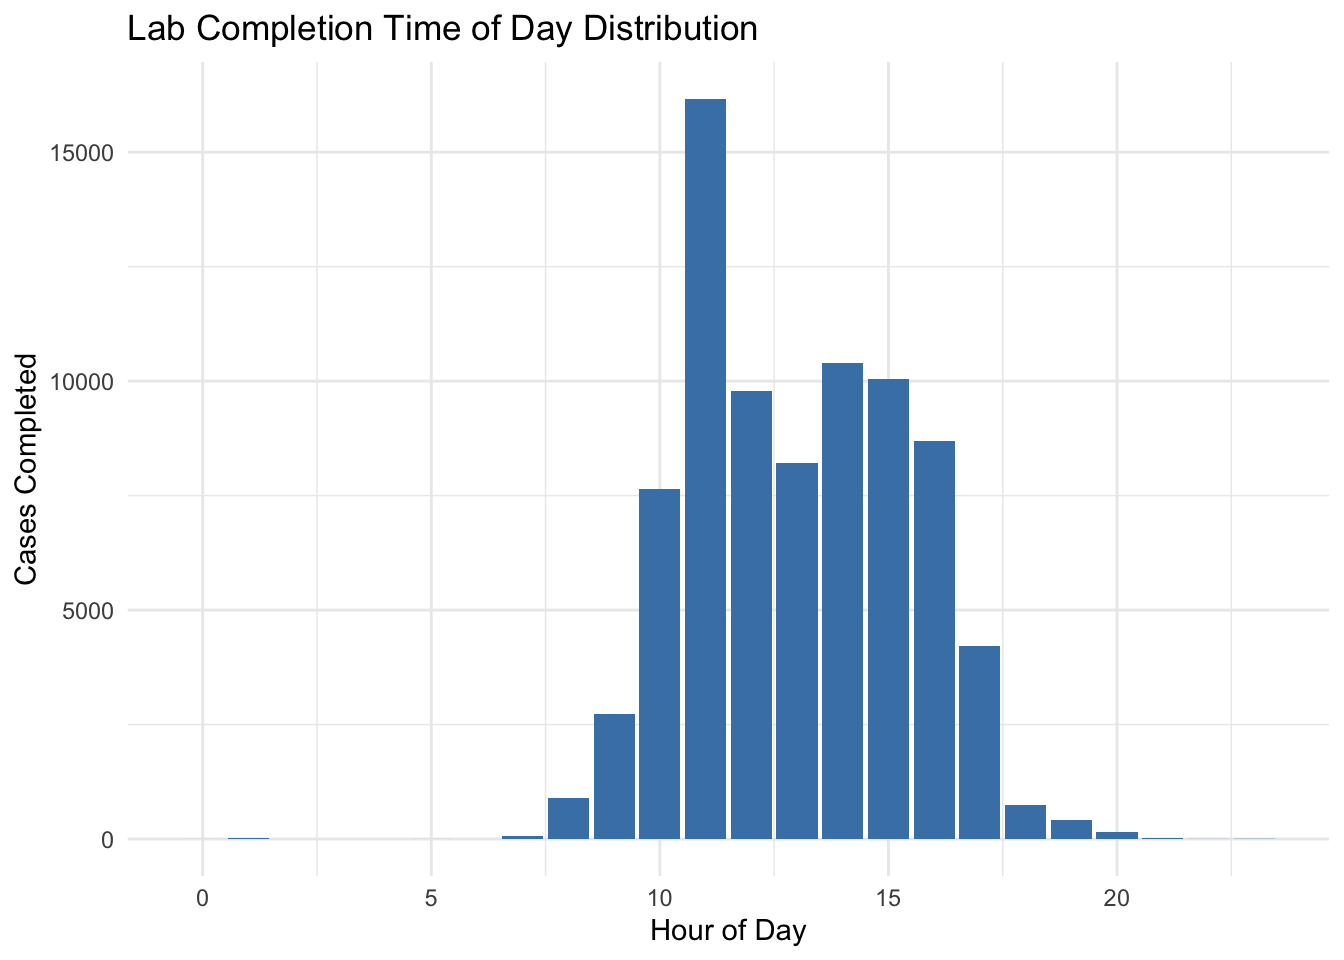
The following plot shows the distribution of the hour of the day when staining was completed.
4.2.3 Summary Statistics
Summary statistics for daily case volume:
   Min. 1st Qu.  Median    Mean 3rd Qu.    Max.
    1.0   119.0   138.0   136.5   157.0   218.0